Articles by: admin

May state employment: At what cost?

The Bureau of Labor Statistics released state-level employment data for May this morning. Looking over the last two months, where things stand since March, largest job losses are in Hawaii, Michigan, New York, and Nevada, all around 20%. There’s a big cluster of states that lost about 15% of their employment over the two months, including the Eastern states not listed above, and Kentucky. Clustered just above 10% are many large Western and Midwestern states, West Virginia, North Carolina, and New Mexico. Those down 10% and less include more of the Southern states, and the Plains and Mountain states. Smallest two-month declines were in Oklahoma and Utah, -6%, followed by Arkansas, Arizona, Idaho, Mississippi, and Nebraska, all -7%.

Our diffusions indexes, which were all 0 in April, except one case of construction hiring, rose to a broad 49 overall, with Leisure & Hospitality, 49, leading the way, followed by education and health, 47, trade/transport & construction, 46, and professional/business services 38. Government work was up in only 2 states, Wisconsin and New Mexico, and DC.

Looking at Leisure & Hospitality employment, only the District of Columbia and Hawaii added to April losses in May, now down 63% for the two months combined. In Oklahoma and Montana L&H work is down only 10% over the two months, and New York, -56%, Massachusetts, -52%, with Delaware & Michigan, 49%, close behind. The largest losses are heavily concentrated in the Northeast and Midwest, with L&H employment off between 40 and 63% in fifteen states. California, Oregon and Connecticut are at the bottom of that column, within striking distance of -40%.

Losses of, very roughly, 10%, in Oklahoma and Montana, to 35%, Maine, Ohio, Wisconsin, are concentrated in the Mid- and South-West, the mid-Atlantic, and the Southeast. Losses in the Plains states all round to about 20%, and in the Mountain West and across the Southwest generally to the high teens. In Utah, Idaho and Tennessee L&H losses total about -15%. None of this is surprising, and there does seem to be a relaxation between more lax state policies, for now. L&H work in Alaska is down 25%.

This is a noisy series with small samples. Largest declines in unemployment rates occurred in Mississippi & Kentucky, around -5.6 pps; in Indiana, Nevada & Arizona, around 5pps; in Vermont, Ohio, Alabama, and Tennessee, around -4pps. Unemployment rates rose in Minnesota, Connecticut & Florida, and lost less than 1 percentage point in Texas, Wyoming, New York, and Alaska.

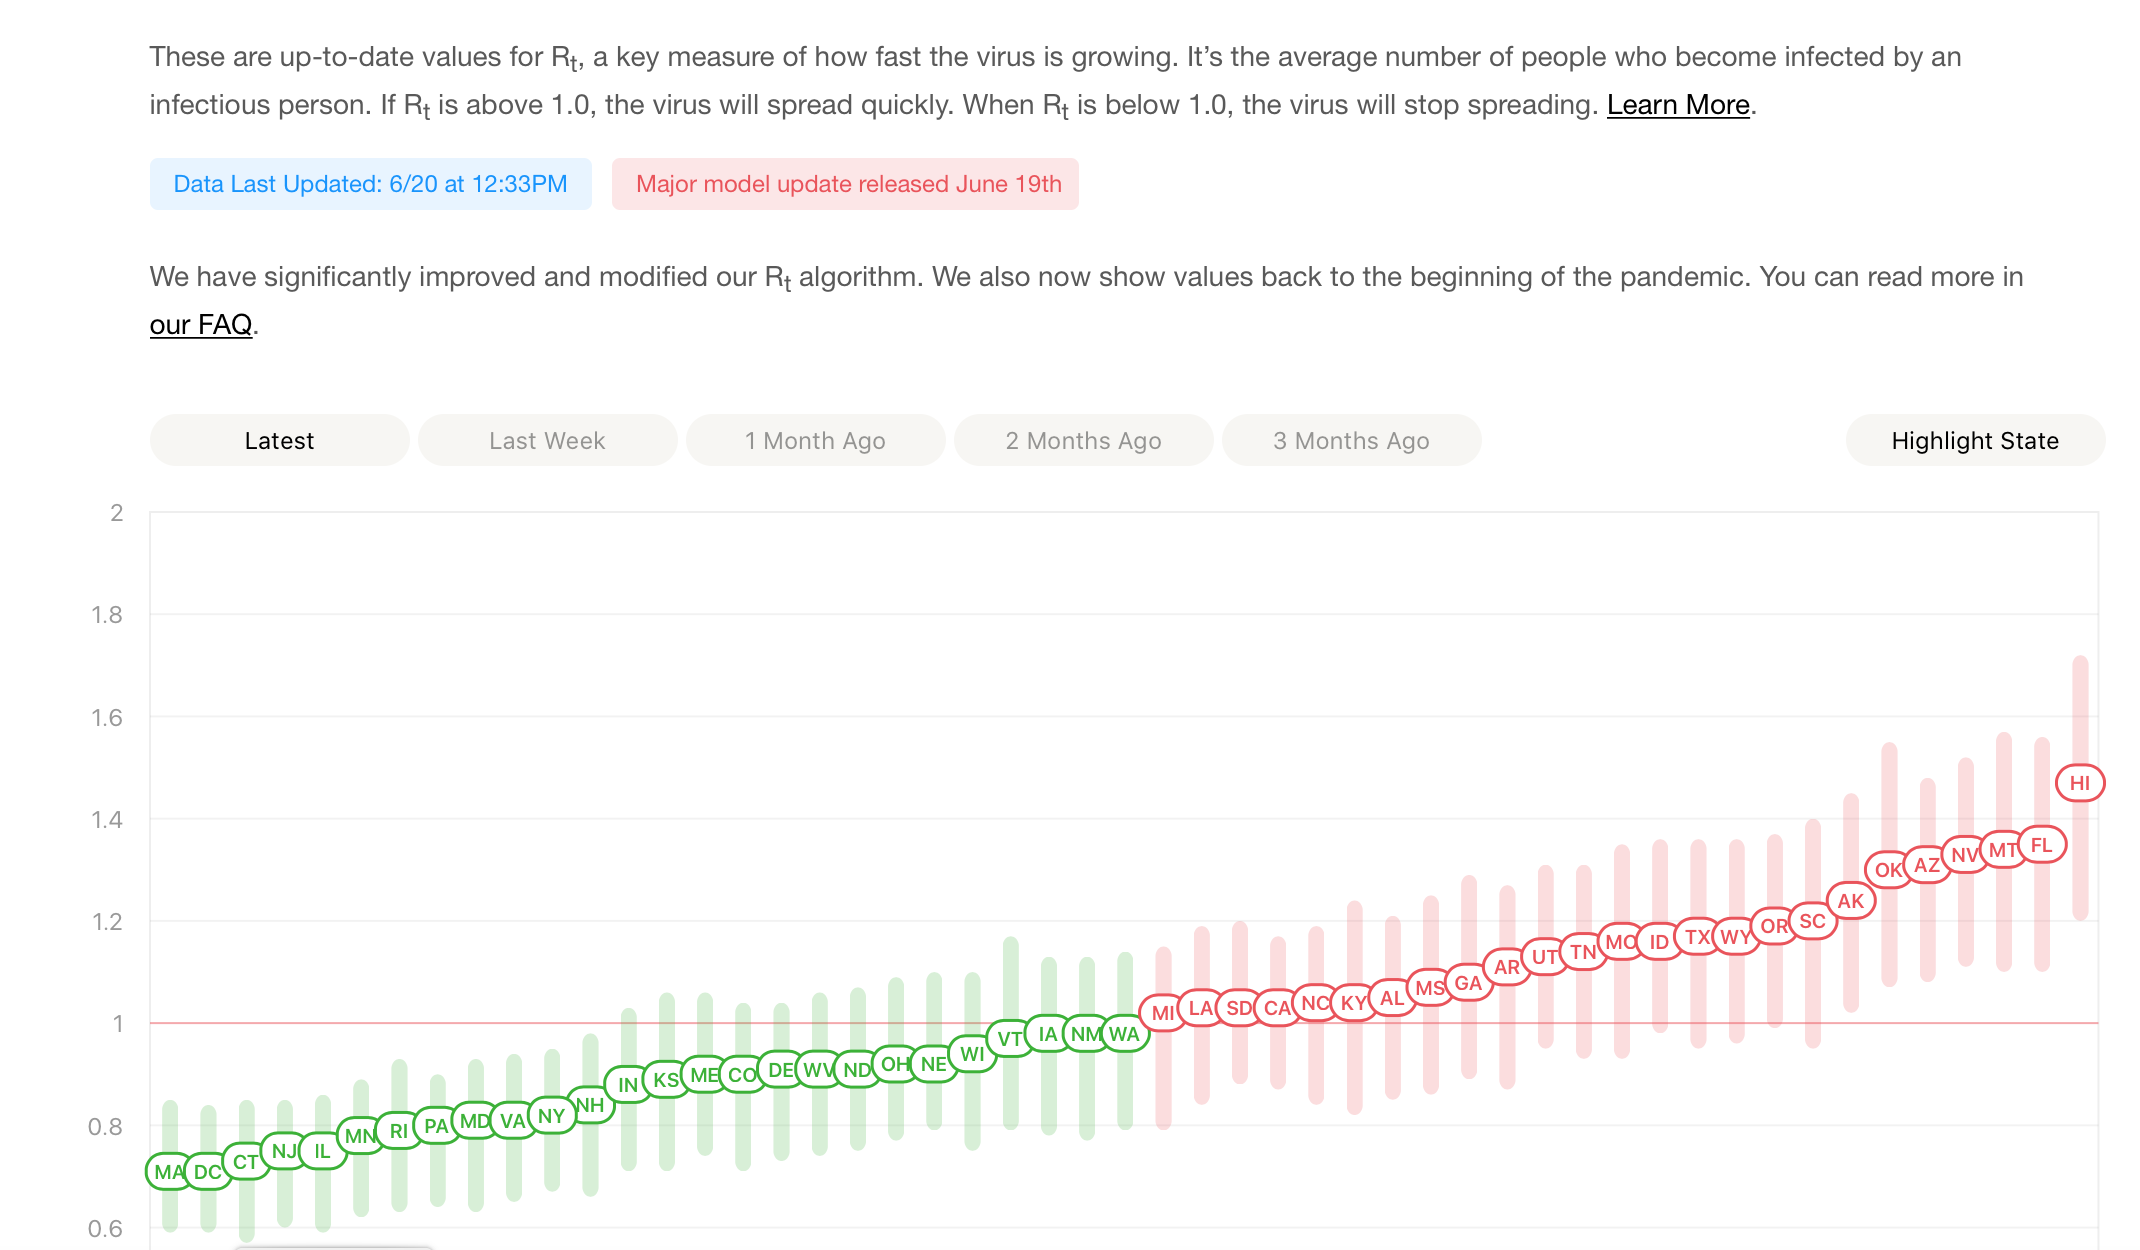
We’d be more encouraged by all of this of 8 more states hadn’t crossed over the line into the “spreading quickly” red zone this morning in the tracker we sent around on Monday.

by admin· · 0 comments · Employment & Productivity

In the US profits = 31% of wage bill; make that 258% in Luxembourg

The Washington Post’s Dana Milbank writes that one of the largest provisions in the relief bill, a $170 billion tax giveaway, “appears to be tailor-made for wealthy real estate investors like Donald Trump and his son-in-law Jared Kushner.” That’s more than the $100 billion for hospitals, and the $150 billion for state and local governments. While we are all wondering why the pandemic should allow these guys to write off losses from before the pandemic, as in 2018 and 2019, we thought we’d dust off another snapshot of shameless greed, our review of a NBER paper on pre-tax profits in tax haven and non-haven countries. graphs snapped from the paper.

According to standard explanations, the low and declining corporate tax rate around the world is the result of jurisdictional competition in a globalized world—offer a friendly tax environment or corporations will move. A new NBER working paper by Thomas R. Tørsløv, Ludvig S. Wier, and Gabriel Zucman (TWZ), says otherwise: multinational corporations (MNCs) are shifting an enormous share of their profits to low-tax havens without moving a single capital good. According to the authors, contrary to economic theory, “[i]nstead of increasing capital stocks in low-tax countries, boosting wages along the way, profit shifting merely reduces the taxes paid by multinationals, which mostly benefits their shareholders, who tend to be wealthy.”

A striking example of how this works: a couple of years ago, Google was booking close to $20 billion in revenues in Bermuda, a country it does almost no business in. That’s a striking example of how this sort of high-end tax avoidance works, but how big is it? TWZ attempt an estimate by scrutinizing the accounts of the havens. Their conclusion: close to 40% of MNC profits is shifted to tax havens. The biggest avoided jurisdictions are in the EU, and the biggest shifters are disproportionately based in the U.S.

One of the ways TWZ estimate the shifting of profits is by comparing corporate profits to wage bills by country. The average for non-haven countries is 36% (that is, pretax profits are 36% of the compensation of employees); for the U.S. it’s 31%. In Luxembourg, the figure is 258%; in Ireland, 242%; in Puerto Rico, 229%. Singapore and Hong Kong are around 100%. For some U.S. firms, profits are over 500% of the wage bill. None are this high because of massively high productivity; capital stocks are relatively low. Almost all the big profit numbers are from tax-shifting. Techniques include manipulating the pricing of intrafirm transfers (exporting to haven affiliates at low prices, and buying from them at high one); dummy loans from overseas affiliates, which produce big interest deductions in the home country; and locating valuable intellectual property offshore and paying high but economically meaningless royalties to the low-tax subsidiary.

The hits to revenue are large. TWZ estimate that tax shifting costs the EU 18% of its corporate tax revenue; the U.S., 14%; and developing countries, 7%. For the world as a whole, the loss is 10%.

All this movement of money plays havoc with macroeconomic statistics. For example, TWZ point out that the already-reported rise of the capital share of national income in the EU is probably understated. (They refer to estimates in a 2013 NBER paper by Loukas Karabarbounis and Brent Neiman, which found a steady decline in the labor share of national income in most parts of the world, with Japan and core EU countries (other than the UK) outdoing the U.S.) And reported current account deficits look worse than they should, because of all the accounting games. Adjusting for tax shifting, Japan, the US, France, and Greece would have had trade surpluses rather than deficits in 2015, and the U.S. deficit would have been reduced by a quarter.

Currently, most international tax disputes are between the high-tax countries; the low-tax ones get barely any attention. That doesn’t seem like a good use of resources.

by admin· · 0 comments · Comments & Context

In Barron’s

Randall Forsyth culls the attached text: That was despite some backpedaling on Friday, following January’s employment report, which was less spectacular than the 225,000 increase in nonfarm payrolls would suggest. Relatively warm weather helped construction jobs rise by 44,000, after seasonal adjustment, four times their average gain of the past year, notes TLR on the Economy. The unemployment rate ticked up by 0.1 of a percentage point, to 3.6%, but for the positive reason that more folks entered the labor force.

by admin· · 0 comments · TLR in the News

We keep our eyes on the data, both the kind that helps you with financial planning and investment, and the kind that helps us all evaluate our socio-economic structures.

In addition to sending you unique insights derived from ongoing conversations with state-level revenue estimators–economists & statisticians, not politicians–we look at a lot of incoming data. We concentrate on details that have been overlooked in the mainstream, and we’re always on the lookout for data abuse, reflecting either misunderstanding or ideological slant. Known for our expertise, we focus on labor and debt data. Please see examples below.


Subscribe >

by admin· · 0 comments · TLR Wire

Little Wonder the BQE is about to Fall Over

For another striking measure of shortfalls in public and private investment, check out the graph below. These are real dollar amounts, not percentages of GDP. In real dollar terms, net fixed investment of all kinds is 20% below where in was in 2005. Net private nonresidential investment is just 12% above where it was in 2007. Net residential investment is 63% below where it was at the peak of the housing bubble, 2006. And net public investment is 39% below. Again, real dollars. These are paltry numbers considering that real GDP is up 36% since the pre-recession peak in 2007.

So net private investment is limp, and net public investment is struggling to keep one nostril above water. This has a lot to do why it feels like things are falling apart, and not just in rural America. An important section of the Brooklyn–Queens Expressway is about to fall down, and there are many other similar cases across the country. Visitors from China routinely express shock about the state of the infrastructure in a country that is still far richer than theirs. And crises like the coronavirus really bring home the effects of inadequate public and private investment. Tending to long-lasting things has gotten highly unfashionable, but that approach has some pitfalls.

by admin· · 0 comments · Comments & Context, TLR Wire