For another striking measure of shortfalls in public and private investment, check out the graph below. These are real dollar amounts, not percentages of GDP. In real dollar terms, net fixed investment of all kinds is 20% below where in was in 2005. Net private nonresidential investment is just 12% above where it was in 2007. Net residential investment is 63% below where it was at the peak of the housing bubble, 2006. And net public investment is 39% below. Again, real dollars. These are paltry numbers considering that real GDP is up 36% since the pre-recession peak in 2007.
So net private investment is limp, and net public investment is struggling to keep one nostril above water. This has a lot to do why it feels like things are falling apart, and not just in rural America. An important section of the Brooklyn–Queens Expressway is about to fall down, and there are many other similar cases across the country. Visitors from China routinely express shock about the state of the infrastructure in a country that is still far richer than theirs. And crises like the coronavirus really bring home the effects of inadequate public and private investment. Tending to long-lasting things has gotten highly unfashionable, but that approach has some pitfalls.
 More Info...
Subscribe >
More Info...
Subscribe >
 More Info...
Subscribe >
More Info...
Subscribe >
Little Wonder the BQE is about to Fall Over
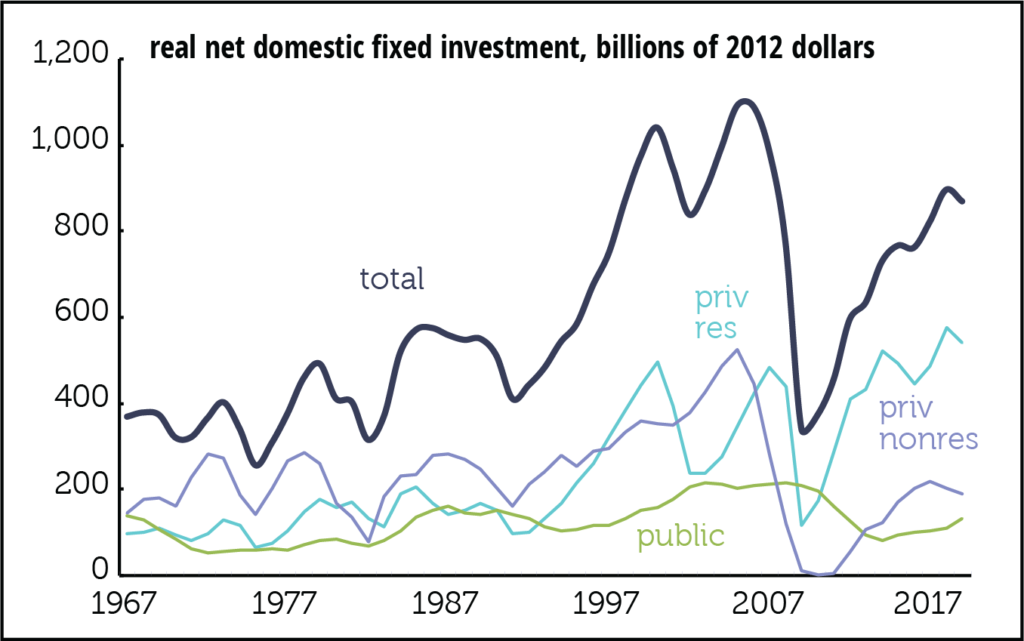
For another striking measure of shortfalls in public and private investment, check out the graph below. These are real dollar amounts, not percentages of GDP. In real dollar terms, net fixed investment of all kinds is 20% below where in was in 2005. Net private nonresidential investment is just 12% above where it was in 2007. Net residential investment is 63% below where it was at the peak of the housing bubble, 2006. And net public investment is 39% below. Again, real dollars. These are paltry numbers considering that real GDP is up 36% since the pre-recession peak in 2007.
So net private investment is limp, and net public investment is struggling to keep one nostril above water. This has a lot to do why it feels like things are falling apart, and not just in rural America. An important section of the Brooklyn–Queens Expressway is about to fall down, and there are many other similar cases across the country. Visitors from China routinely express shock about the state of the infrastructure in a country that is still far richer than theirs. And crises like the coronavirus really bring home the effects of inadequate public and private investment. Tending to long-lasting things has gotten highly unfashionable, but that approach has some pitfalls.