Archive for May, 2021

In the Labor Force & in Poverty

According to a recent Bureau of Labor Statistics report there were 34.0 million people, or 10.5% of the population, living below the poverty level in the United States in 2019. Although these are “primarily” adults who are not in the labor force, and children, 6.3 individuals constitute the working poor, those who were in the labor force for at least 27 weeks, working or looking for work, but whose incomes remain below the poverty level. But, that population as a share of all individuals who were in the force for the requisite weeks, fell to 4.0% in 2019, the lowest in the series that goes back to 1986, from 4.5% in 2018. In 1986 the rate was 6.2%, dropped and then rose to 6.7% in 1993, fell into 2001, topped out at 7.2% in 2010, and has been steadily falling with a mini plateau in 2017-18.

Full-time employment (FT) helps a lot, with only 2.7% of those working FT among the working poor, but 9.8% of those working part-time. Women are “more likely” to be among the working poor, 4.5%, than men, 3.5%, and Blacks and Latinos are “much more likely” than Whites and Asians to be so classified. 2.3% of Asian workers earn wages below the poverty level, as do 3.5% of White workers, 7.0 of Hispanic workers, and 7.2% of Black workers. Asian men, 2.4%. have a higher rate than women, 2.3%, but rates for women are higher in all other demographics. The highest rate, 14.5%, is among black women aged 24 to 34 or in their teenaged years, followed by Black men aged 20-24, 10.7%.

Education matters, but it’s no shoo-in. About eleven percent of white workers with four years of high school yet no diploma earn poverty wages, as do 22% of Blacks, 13.9% of Hispanics, and 7.5% of Asians. Overall, only 1.4% of those with Bachelor’s degrees are among the working poor, no difference between men and women. Although white women with BAs are only 0.1pps more likely to be in poverty than men, 1.4%, 1.9% of Black women with college degrees rank among the working poor, as do 0.8% of men, the smallest share. That breakout is reversed among Asian workers, with women at 0.9%, while among Hispanic workers, women are above, 1.9%, and men a bit below, 1.6%, the average, 1.7%.
One fifth of families maintained by women with a child under 18, a demographic we and many others consider highly motivated, earn wages beneath the poverty line, more than twice the share of families maintained by men, 9%. Families with children under 18 and one person in the labor force were five times as likely to live in poverty as those without children.

by admin· · 0 comments · Employment & Productivity

Alabama Jumpers & Jobs

In a recent piece, Margaret Renkl detailed how the native species that once presaged spring have handed the job over to those from the old world that bloom earlier in the year. Acknowledging that many of the beautiful landscapes we have created are largely barren to our native fauna, and that many of our native early bloomers are now threatened in parts of their ranges, she ended, nevertheless, with the thought that the beautiful Yoshino cherries that flower in early spring now belong, “as much to the National Mall,” as they do to Japan.

And what a coincidence. Two days later, forest biologist Dr. Andrea Dávalos, of SUNY Cortland, mentioned in her presentation on the invasive jumping worms chewing into our woodlands that they are believed to have arrived in a 1912 shipment of thousands of cherry trees, a gift from the Japanese counsel to first lady Helen Taft who was partial to the trees. The cherries were eventually planted along the Mall, a beautiful gift gone wrong.*

By the 1940s, the jumping worms were being fed to platypuses in the Bronx Zoo, and sometime in the 1980s they made the jump to the North American wild. Now known by many names, including Alabama jumpers or Jersey wigglers, hitchhiking in bags of dirt, plant specimens, on our shoes, or populating from discarded fishing bait, they have made it into Canada and have been reported in Oregon.


Geum triflorun, Prairie Smoke, endangered in its Michigan and Western New York ranges.

Here’s the problem. Our northern forests grew up without worms. Most of our once-native worms are believed to have been ground away by the glaciers, and those that survive tend to live in wetlands.
Because there were no worms churning up the top soil, over the centuries a deep layer of duff developed on forest floors, becoming the requisite habitat of our woodland species, trillium and dog-tooth violets, ground-nesting birds, like thrushes and ovenbirds, the latter partial to urban playground structures during migration, and many amphibians. As the worms turn the soil layer into something that resembles coffee grounds, native invertebrates die off, and our salamanders lose food staples like millipedes, and are unable to consume the worms that can be bigger than they are.

We’re still learning how mycorrhizae function, but as these symbiotic relationships between mushrooms and plants break down, the soil comes so weak it can’t support our weight. No danger of falling into the Earth’s mantle, but in the breakdown our forest floors change from fungal dominated to bacterial dominated. As we learn more about degraded habitats and the transmission of dangerous pathogens, it is not alarmist to raise a red flag here.

And it that doesn’t get your goat, the worms are creating real problems on golf courses, for example in Kentucky, where the castings obstruct the ball and “are gross,” in forest ecologist terminology.
Where to start?

Dr. Dávalos knows exactly where. Killing off the worms is not an option—we need a broader approach, and many hands on deck. She and her colleagues are investigating the inter-relationship between jumping worms and invasive species in several sites in the Catskills. The work includes looking into possibly related sugar-maple die-offs, how invasive plants are favored over slower growing native species, some under scientific investigation for medicinal properties, in the degraded soils, as well as how our over-populations of deer make the whole mess a lot worse. All of this work can, and we would argue should, be scaled throughout our vulnerable forests.

The average STEM income is about $90,000, and biological techs and surveyors make about half that. Low for STEM, but well above the average pay for retail and restaurant work. And in sparsely populated rural areas with slim opportunity, the surveys Dr. Dávalos and her team are conducting are labor intensive. In addition to hiring young STEM graduates, these surveys take on and train relatively unskilled workers, allowing them entry to STEM careers

Job-world is looking up, but many remain sidelined. Projects that document the complicated relationships between invasive and native species provides real opportunity in rural regions, as well as being a main support of climate science.

To participate in the study, please get in touch with: andrea.davalos@cortland.edu, or learn steps you can take here.

by admin· · 0 comments · Comments & Context

April Retail Sales: That Whiplash Feeling

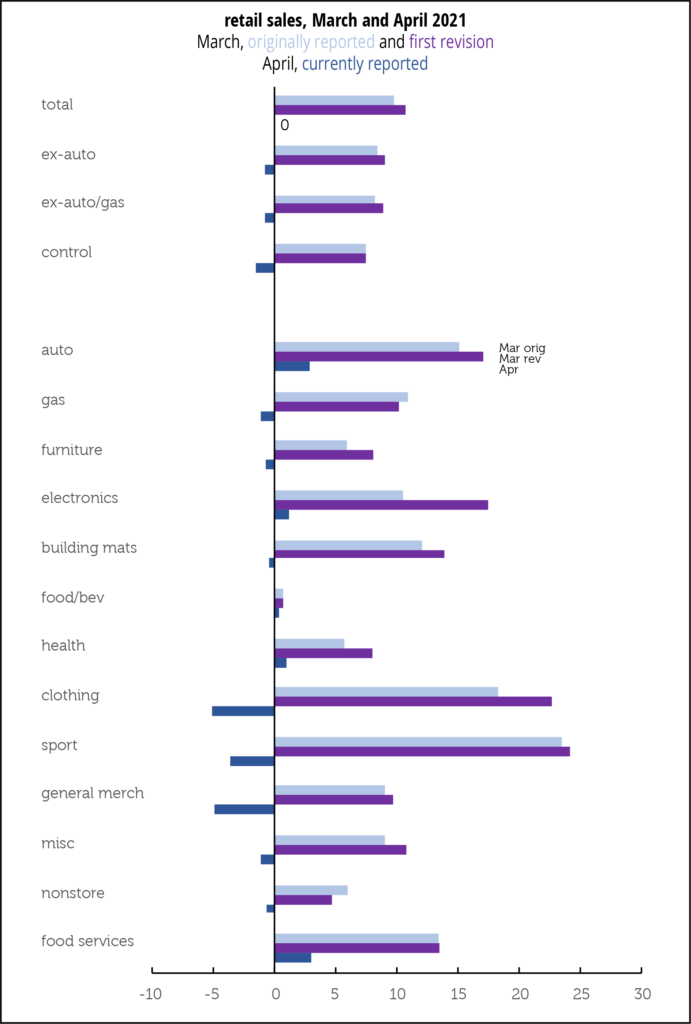
If you have that whiplash feeling, you must be looking at the April retail sales report. It’s amusing that behind the flat month the over-the-year gain, 51.2%, is within three percentage points of the yearly gain in our survey of state sales tax receipts. Beneath that unchanged headline, and a 0.8% decline excluding automobiles, and excluding automobiles and gas, we have a 726% over-the-year increase at clothing & accessory stores, which turns into a 5.1% over-the-month decline from March’s 115.4% over-the-year and 22.7% over-the-month increases. March’s headline was revised up by a 0.9 percentage points to 10.7%, and so was everything else except grocery stores, nonstore retailers, down 1.3pps, and gas stations, down 0.7pps, with a few categories unchanged. Sales in electronic stores were revised up by a dazzling 7pps.

Here’s what it all looks like:

by admin· · 0 comments · Comments & Context

Inflation? ISM Indexes

Since disinflation, flirting occasionally with deflation, took over the economic scene in the early 1980s, there have been a few “inflation is back!” scares. How do current concerns stack up?
Price measures in the ISM reports confirm the verbal alarm expressed by respondents recently. The manufacturing price index was 89.6 in April; services, 76.8. Manufacturing is at the 98th percentile in the series’ history (which begins in 1948); services, at the 99th (a much shorter series—it begins in 1997). But, as the graph on the top of p. 4 shows, we’ve been here many times before. We’ve graphed only manufacturing, below, because of its much longer history. The services index traces a path very similar to manufacturing since it began in 1997; the correlation coefficient is 0.82.

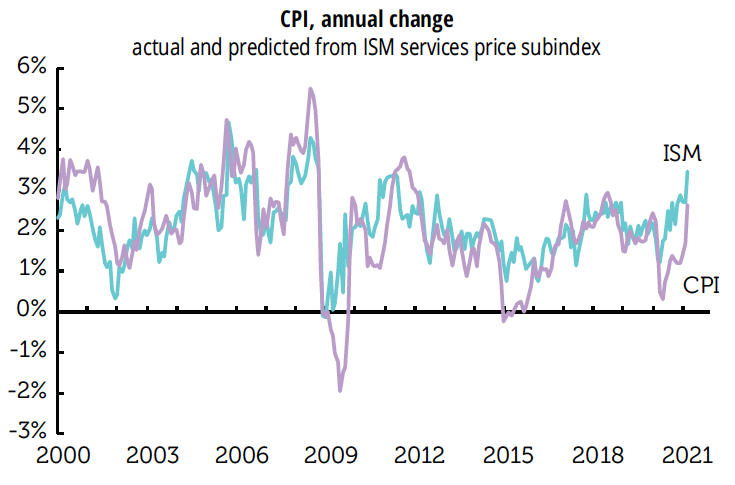
Oddly, the low-inflation era since the early 1980s looks little different from the rising inflation era before it. That cautions against drawing any trend conclusions from the high current readings. But, over the last twenty years, the two price indexes do track moves in the CPI pretty well. Here’s a graph of the actual yearly change in the CPI against one predicted by the ISM services price subindex.

It’s suggesting that the CPI “should” be rising at a 3.5%, almost a full point above where it was in March, and considerably above the Fed’s 2.0% target (though that target looks to be in abeyance, at least for now).

by admin· · 0 comments · Uncategorized

Curiosity-Driven Research & a Random Walk

“Talent vs. Luck: the role of randomness in success,” written by two theoretical physicists, A. Pulchino, and A. Rapisarda, and one economist, A.E. Biondo, contrasts the “normal distribution of inputs,” in this case talent and other personal traits competitive cultures tend to associate with success, with the actual distribution of the wealth we find in our real world, which follows a power, or Pareto law.

We’ll highlight one random example, that old aardvark thing. One team found the lucky owners of surnames with initials that occur early in the alphabet are “significantly more likely” to be tenured in top-ten economics departments—where the norm is the list co-authors alphabetically—and somewhat more likely to receive Clark medals and Nobel prizes, even controlling for place of birth, religion, and ethnicity. That effect disappears as the lens takes in the top 35 departments, and doesn’t exist in top psychology departments where co-authors are listed by contribution.

There is lots more in the name department, valuable middle initials, easy to pronounce names, women with “masculine monikers” better off in law careers, noble-sounding names leading to management positions. And, one to focus on, that innovative ideas are often the results of a “random walk in our brain network.”

The idea is not that successful people are without talent, need we say?, but that talent isn’t enough, and that random luck plays out in subtle ways, leading to what Nassim Taleb calls “narrative fallacy,” and Paul Lazarsfeld, “hindsight bias.” The study finds that “ordinary people with an average level of talent,” are more likely to be successful if luck cooperates than are the “most talented” ones.
And here they get to a more promising place. Serendipity is important in research breakthroughs—penicillin, cosmic radiation, and graphene, one million times thinner than paper and stronger than diamond—were all happened upon by people looking for something else. Which is why, since we can’t know before we get there, many believe curiosity-based research should “always be funded.”
The tams cites some strategies to back off “naively meritocratic assumptions,” that impede innovation by of yet unrecognized talent, while pumping up the incumbents. They cite one study of scientific publications that found impact per dollar of funding was lower when the money went to large-grant holders, another that found “concentration” of research funding shows narrowing marginal returns, and that the best-funded researchers do not “stand out in terms of output or scientific impact.”
What we believe to be a meritocratic strategy pursues “excellence while driving out variety,” by directing resources away from research that a priori appears less promising, but a posteriori, could be “extremely innovative.”

So, which criteria? Best to give the same funding to everyone, egalitarian; only to the apparently most successful, elitarian; give a premium to the most successful and the left over to all others, mixed; or only to a given number of randomly selected researchers, selective random?
The authors find it is “much more convenient,” in that it seems to double the number of researchers both successful and among the most talented, to award periodic, even small, amounts to all individuals than to give greater capital to only a smaller percentage.

As you have probably guessed from the set-up, the elitarian strategies produce the weakest results, with the increase in the number of successful people “very small” compared to no funding at all. The mixed approach does better, but does not overtake egalitarian strategies, or the random strategies that occupy two of the three top results. With some random alignments, we get to four times the results enabled by the elite strategies.

The authors suggest equal distribution could both give unlucky yet talented people the chance to “express their potential,” while fostering serendipity at the aggregate level, which would contribute both to the progress of research, and our entire society, fulfilling the “main aim of a truly meritocratic approach.”

Disparity in research funding is often cited as a reason it’s hard to attract top talent to state universities, institutions central to promoting upward mobility. Curiosity-driven research wants to know what might happen with some random funding.

by admin· · 0 comments · Comments & Context