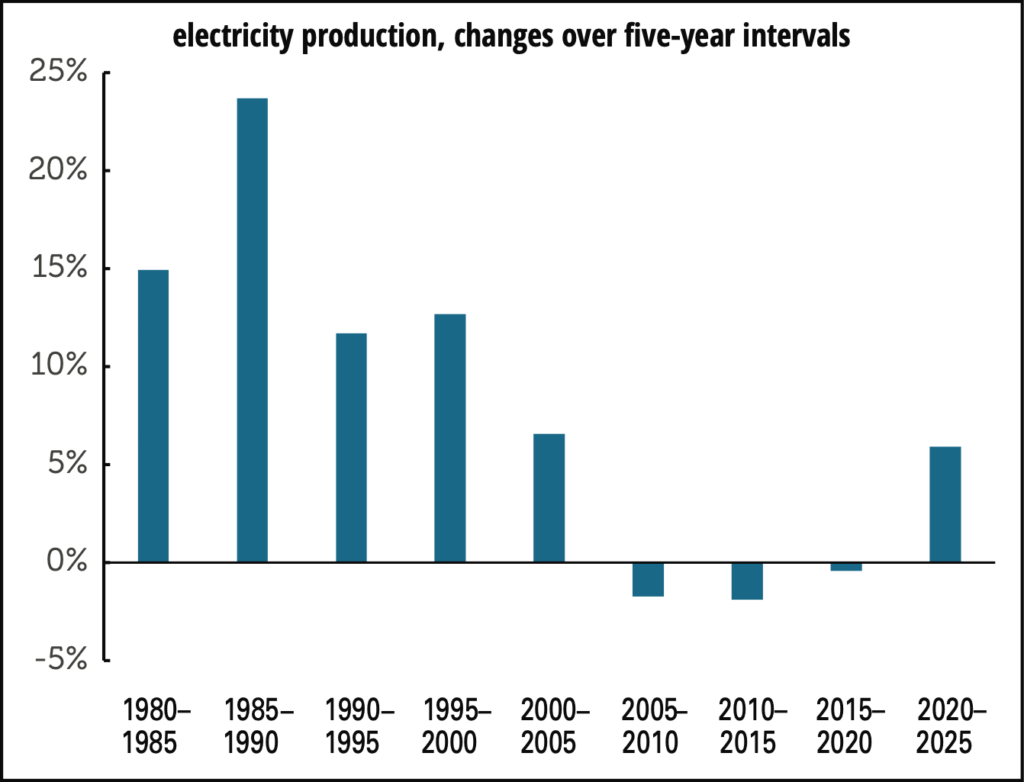
AI is making enormous demands on electricity grids around the world. Exactly how enormous isn’t easy to say, since statistical agencies aren’t reporting the AI sector separately and the companies themselves aren’t exactly forthcoming about the topic. So researchers have to do a bit of guesswork to come up with some numbers. A recent article in MIT Technology Review by James O’Donnell and Casey Crownhart is one of the latest efforts to do so. Unusually, the authors start from the query level and work upwards to the macro. A simple text query doesn’t make many demands—”about what it takes to ride six feet on an e-bike, or run a microwave for one-tenth of a second,” in O’Donnell and Crownhart’s words. […]
-
Erika McEntarfer in, mostly, her own words
The rust belt resonates with labor historians, but we generally don’t use the term. Years ago our friend Kim Hill, then at the Center for...
-
The BLS over time: “A tin can tied to my coat tail”
We have worked closely with the Bureau of Labor Statistics for decades and, in the belief that people are more likely to value what they understand,...
-
How to Diversify Ecological Science
Karina A. Sanchez, Amanda J. Bevan Zientek, and Emily A. Holt just released their study of college students’ awareness of institutional, structural,...


