State university systems or collapsing bridges? Our choice
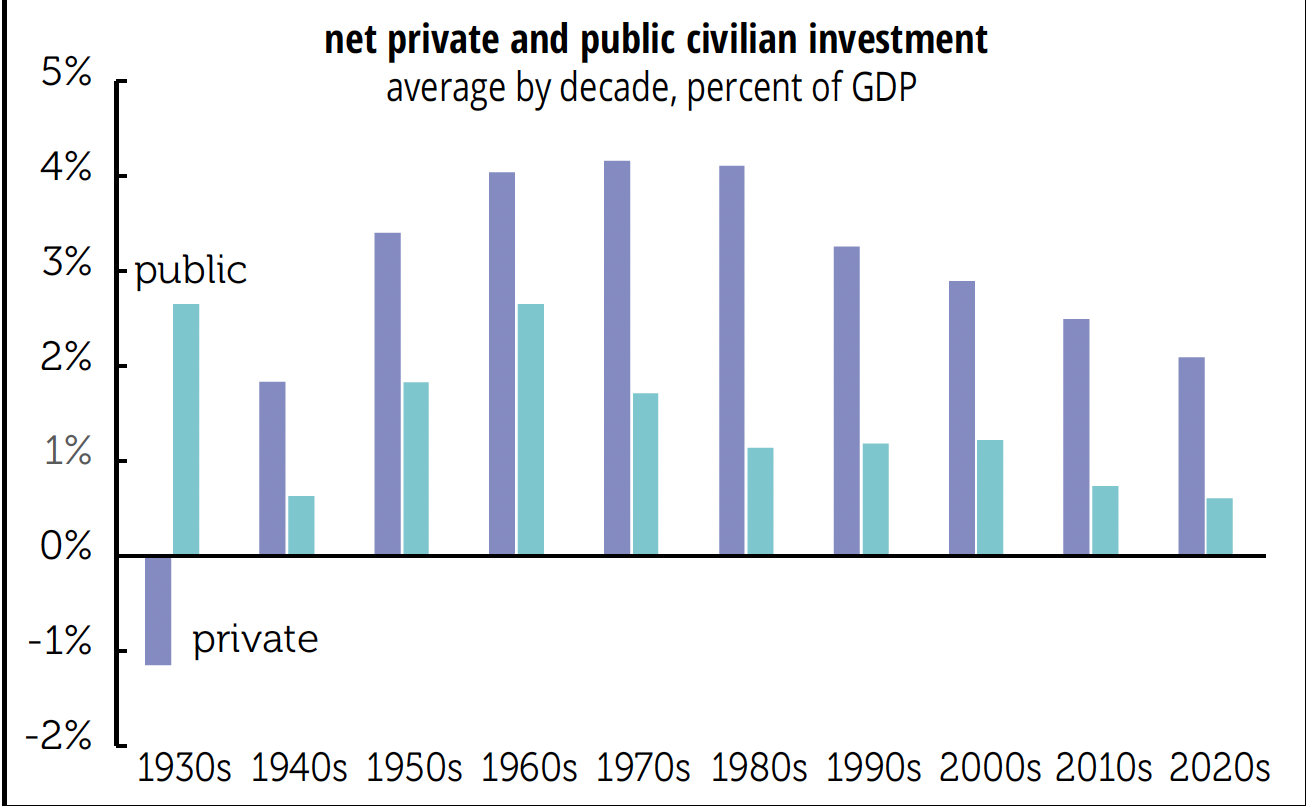
It’s been a while since we looked at net investment in the US, and we weren’t surprised to learn that the basic story hasn’t changed. Private investment is only a bit ahead of depreciation, and public investment even less so. So far in 2022, net fixed investment by the private sector has been 2.1% of GDP, which is also its average so far for the decade. As the graph on below shows, that’s about half what it was from the 1960s through the 1980s and is only slightly above what it was in the 1940s, the decade when civilian investment was squeezed to supply war needs:
Low levels of net private investment aren’t driven by declines in gross investment, which has been pretty stable. Instead, the major reasons for the decline are a shift towards shorter-lived equipment and the immateriality of intellectual property (IP) and a shift away from buildings. From 1950–1999, net fixed private investment averaged 32% of gross; since 2000, it’s averaged 20%—and 16% since 2020. Every asset category has seen that shift. Net equipment investment went from 24% of gross from 1950–1999 to 15% since 2020. Even nonresidential structures aren’t being built for the ages; they went from 49% of gross to 16%. (Are they just building self-storage units these days?) And IP isn’t what it used to be either; its net went from 23% of gross in the earlier period to 16% in the most recent.
Residential net investment isn’t doing too great either: it went from an average of 2.8% of GDP from 1950 to 1999 to 1.7% in the 2020s. Unlike the mid-2000s housing bubble, which took net residential investment up to 3.8%, the highest since the post-World War II decade, the latest bubble took net housing investment up to just 1.9% of GDP last year. It’s fallen back to 1.4% in 2022. That’s not the way to meet a housing deficit estimated by Freddie Mac at 3.8 million units.
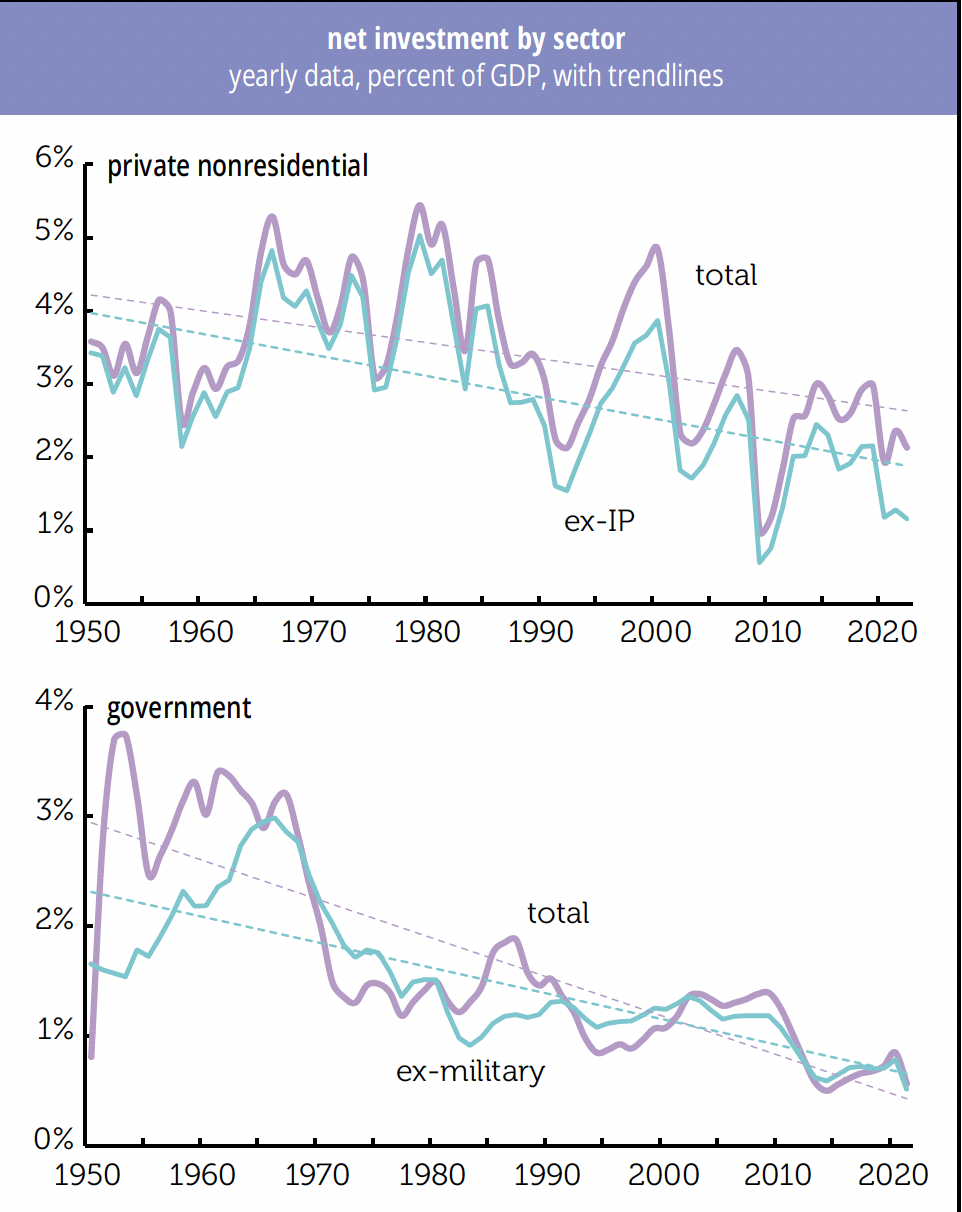
For the public sector, the decline in net investment has been more dramatic, falling from around 2% of GDP in the early decades on the graph to 0.4% since 2020. (It’s 0.3% so far in 2022.) Like the private sector, we’ve seen a shift towards shorter-lived assets, but unlike the private sector, we’ve also seen a decline in gross investment, which fell by almost half between the 1960s and 2020s. Net federal civilian investment is just 0.1% of GDP so far this decade, a third its 1950–1999 average. State and local investment has fallen harder, down by almost three quarters from that 50-year average to 0.5% in the 2020s (0.3% so far this year).
The graphs below give a yearly view since 1950. They tell the same story: steady decline, with cyclical oscillations around the trend. The burst of net private investment in the late 1990s gave us a major productivity acceleration, but it was not to last. And the burst in civilian public investment from the early 1950s through the late 1960s gave us interstate highways, schools, and state university systems. The long declines in net investment, both private and public, have given us stagnant productivity growth and a collapsing infrastructure.