The Washington Post’s Dana Milbank writes that one of the largest provisions in the relief bill, a $170 billion tax giveaway, “appears to be tailor-made for wealthy real estate investors like Donald Trump and his son-in-law Jared Kushner.” That’s more than the $100 billion for hospitals, and the $150 billion for state and local governments. While we are all wondering why the pandemic should allow these guys to write off losses from before the pandemic, as in 2018 and 2019, we thought we’d dust off another snapshot of shameless greed, our review of a NBER paper on pre-tax profits in tax haven and non-haven countries. graphs snapped from the paper.
According to standard explanations, the low and declining corporate tax rate around the world is the result of jurisdictional competition in a globalized world—offer a friendly tax environment or corporations will move. A new NBER working paper by Thomas R. Tørsløv, Ludvig S. Wier, and Gabriel Zucman (TWZ), says otherwise: multinational corporations (MNCs) are shifting an enormous share of their profits to low-tax havens without moving a single capital good. According to the authors, contrary to economic theory, “[i]nstead of increasing capital stocks in low-tax countries, boosting wages along the way, profit shifting merely reduces the taxes paid by multinationals, which mostly benefits their shareholders, who tend to be wealthy.”
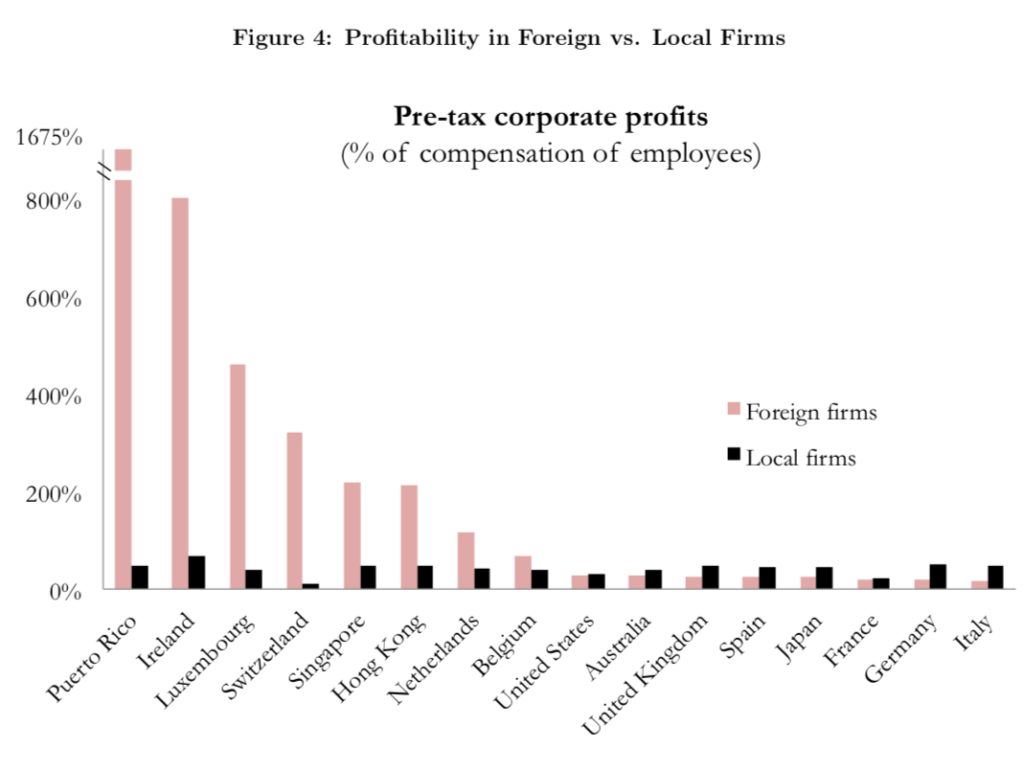
A striking example of how this works: a couple of years ago, Google was booking close to $20 billion in revenues in Bermuda, a country it does almost no business in. That’s a striking example of how this sort of high-end tax avoidance works, but how big is it? TWZ attempt an estimate by scrutinizing the accounts of the havens. Their conclusion: close to 40% of MNC profits is shifted to tax havens. The biggest avoided jurisdictions are in the EU, and the biggest shifters are disproportionately based in the U.S.
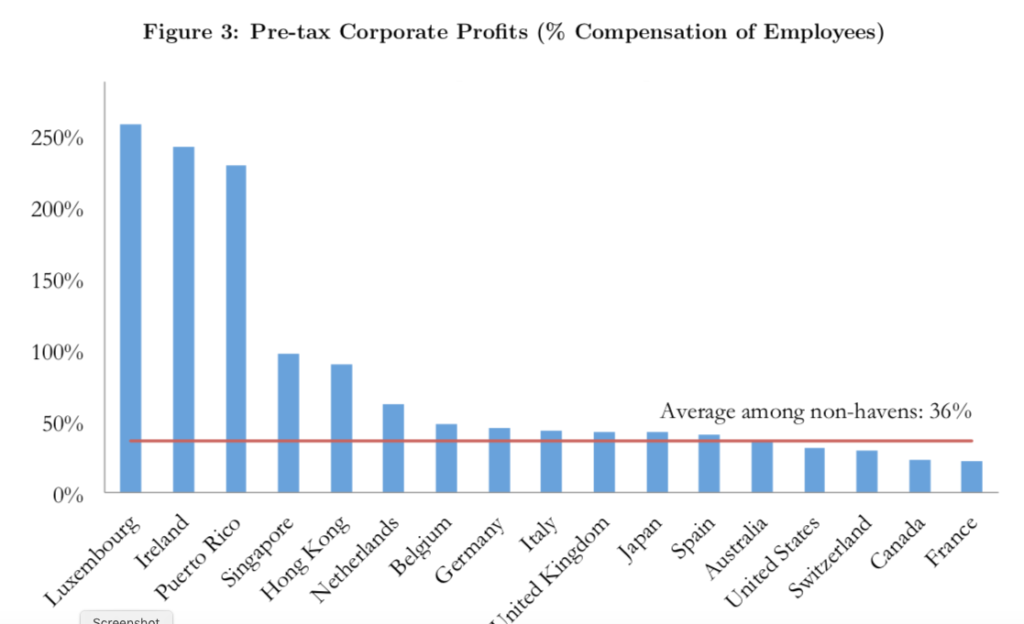
One of the ways TWZ estimate the shifting of profits is by comparing corporate profits to wage bills by country. The average for non-haven countries is 36% (that is, pretax profits are 36% of the compensation of employees); for the U.S. it’s 31%. In Luxembourg, the figure is 258%; in Ireland, 242%; in Puerto Rico, 229%. Singapore and Hong Kong are around 100%. For some U.S. firms, profits are over 500% of the wage bill. None are this high because of massively high productivity; capital stocks are relatively low. Almost all the big profit numbers are from tax-shifting. Techniques include manipulating the pricing of intrafirm transfers (exporting to haven affiliates at low prices, and buying from them at high one); dummy loans from overseas affiliates, which produce big interest deductions in the home country; and locating valuable intellectual property offshore and paying high but economically meaningless royalties to the low-tax subsidiary.
The hits to revenue are large. TWZ estimate that tax shifting costs the EU 18% of its corporate tax revenue; the U.S., 14%; and developing countries, 7%. For the world as a whole, the loss is 10%.
All this movement of money plays havoc with macroeconomic statistics. For example, TWZ point out that the already-reported rise of the capital share of national income in the EU is probably understated. (They refer to estimates in a 2013 NBER paper by Loukas Karabarbounis and Brent Neiman, which found a steady decline in the labor share of national income in most parts of the world, with Japan and core EU countries (other than the UK) outdoing the U.S.) And reported current account deficits look worse than they should, because of all the accounting games. Adjusting for tax shifting, Japan, the US, France, and Greece would have had trade surpluses rather than deficits in 2015, and the U.S. deficit would have been reduced by a quarter.
Currently, most international tax disputes are between the high-tax countries; the low-tax ones get barely any attention. That doesn’t seem like a good use of resources.
 More Info...
Subscribe >
More Info...
Subscribe >
 More Info...
Subscribe >
More Info...
Subscribe >
In the US profits = 31% of wage bill; make that 258% in Luxembourg
The Washington Post’s Dana Milbank writes that one of the largest provisions in the relief bill, a $170 billion tax giveaway, “appears to be tailor-made for wealthy real estate investors like Donald Trump and his son-in-law Jared Kushner.” That’s more than the $100 billion for hospitals, and the $150 billion for state and local governments. While we are all wondering why the pandemic should allow these guys to write off losses from before the pandemic, as in 2018 and 2019, we thought we’d dust off another snapshot of shameless greed, our review of a NBER paper on pre-tax profits in tax haven and non-haven countries. graphs snapped from the paper.
According to standard explanations, the low and declining corporate tax rate around the world is the result of jurisdictional competition in a globalized world—offer a friendly tax environment or corporations will move. A new NBER working paper by Thomas R. Tørsløv, Ludvig S. Wier, and Gabriel Zucman (TWZ), says otherwise: multinational corporations (MNCs) are shifting an enormous share of their profits to low-tax havens without moving a single capital good. According to the authors, contrary to economic theory, “[i]nstead of increasing capital stocks in low-tax countries, boosting wages along the way, profit shifting merely reduces the taxes paid by multinationals, which mostly benefits their shareholders, who tend to be wealthy.”
A striking example of how this works: a couple of years ago, Google was booking close to $20 billion in revenues in Bermuda, a country it does almost no business in. That’s a striking example of how this sort of high-end tax avoidance works, but how big is it? TWZ attempt an estimate by scrutinizing the accounts of the havens. Their conclusion: close to 40% of MNC profits is shifted to tax havens. The biggest avoided jurisdictions are in the EU, and the biggest shifters are disproportionately based in the U.S.
One of the ways TWZ estimate the shifting of profits is by comparing corporate profits to wage bills by country. The average for non-haven countries is 36% (that is, pretax profits are 36% of the compensation of employees); for the U.S. it’s 31%. In Luxembourg, the figure is 258%; in Ireland, 242%; in Puerto Rico, 229%. Singapore and Hong Kong are around 100%. For some U.S. firms, profits are over 500% of the wage bill. None are this high because of massively high productivity; capital stocks are relatively low. Almost all the big profit numbers are from tax-shifting. Techniques include manipulating the pricing of intrafirm transfers (exporting to haven affiliates at low prices, and buying from them at high one); dummy loans from overseas affiliates, which produce big interest deductions in the home country; and locating valuable intellectual property offshore and paying high but economically meaningless royalties to the low-tax subsidiary.
The hits to revenue are large. TWZ estimate that tax shifting costs the EU 18% of its corporate tax revenue; the U.S., 14%; and developing countries, 7%. For the world as a whole, the loss is 10%.
All this movement of money plays havoc with macroeconomic statistics. For example, TWZ point out that the already-reported rise of the capital share of national income in the EU is probably understated. (They refer to estimates in a 2013 NBER paper by Loukas Karabarbounis and Brent Neiman, which found a steady decline in the labor share of national income in most parts of the world, with Japan and core EU countries (other than the UK) outdoing the U.S.) And reported current account deficits look worse than they should, because of all the accounting games. Adjusting for tax shifting, Japan, the US, France, and Greece would have had trade surpluses rather than deficits in 2015, and the U.S. deficit would have been reduced by a quarter.
Currently, most international tax disputes are between the high-tax countries; the low-tax ones get barely any attention. That doesn’t seem like a good use of resources.