The BLS is just out with the Business Employment Dynamics (BED) release for the first quarter of 2019—not exactly breaking news, but of longer-term interest. First quarter gross job gains fell to 5.9% of employment from 6.3% of employment in 2018Q4, while gross job losses slipped only from 5.6% to 5.5%. A year earlier the numbers were 6.1% (gains) and 5.5% (losses). Not only were net gains weaker in 2019Q1 than 2018Q1, job turnover, the combined total of gross gains and losses, 11.4% vs. 11.6%, is down, further evidence of the eroding dynamism of the US economy. From 1992 to 2000, turnover averaged 15.5% of employment; from 2001–2005, 14.2%; since 2010, 12.1%.
BED also includes stats on establishment openings and closings, which is important because employment growth is driven by young (but not newborn) firms. New establishments grew 3.1% in the first quarter, pretty much where they’ve been since 2010. That compares with 3.4% growth in the 1990s and 3.3% in the early 2000s. Despite the unchanged birth rate, the number of jobs produced by these newborn establishments fell to 0.6% of employment, tying the all-time low for the series. Establishment deaths are only reported with a three-quarter delay (gotta make sure they’re dead and not just asleep): closings were 2.9% of the total, up two ticks from the previous quarter, and also 0.2 above the average since 2010. The gusher of entrepreneurship that was supposed to flourish under a regime of tax cuts and deregulation has yet to materialize.
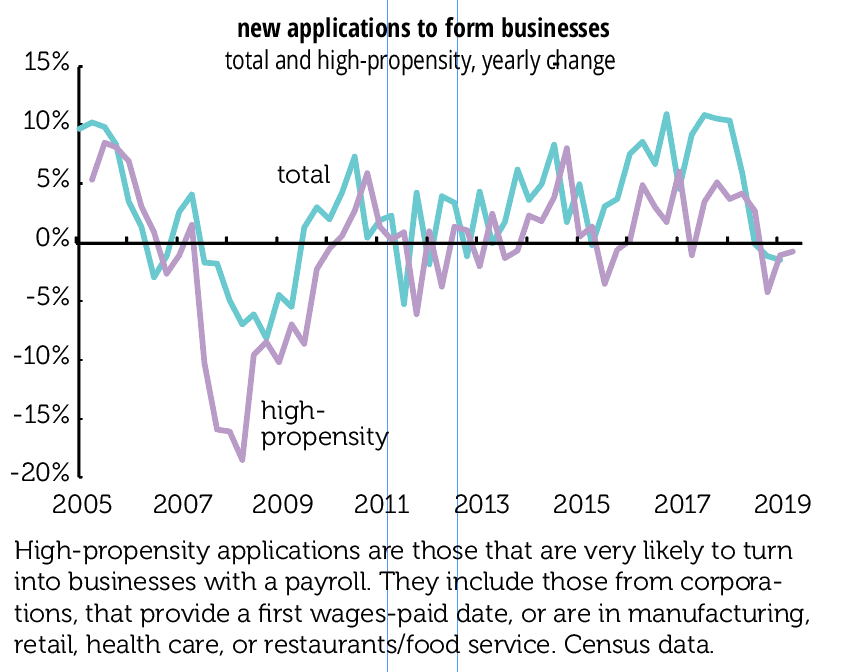
Further evidence of that comes from the Census Bureau’s business application series, which is derived from applications for new employer ID numbers. From those, Census derives a subset with a high propensity of producing a payroll. Third quarter figures were released on October 16. They showed an 0.5% overall decline in applications from the second quarter, an 0.7% decline in high-propensity formations, and a 2.1% decline in those with planned wages. For the year, new applications were off 1.5%, and off 0.8% for high-propensity ones. As this graph shows, there was a brief surge in formations in 2017 and 2018, but that burst of animal spirits looks to have run its course.


Little Wonder the BQE is about to Fall Over
For another striking measure of shortfalls in public and private investment, check out the graph below. These are real dollar amounts, not percentages of GDP. In real dollar terms, net fixed investment of all kinds is 20% below where in was in 2005. Net private nonresidential investment is just 12% above where it was in 2007. Net residential investment is 63% below where it was at the peak of the housing bubble, 2006. And net public investment is 39% below. Again, real dollars. These are paltry numbers considering that real GDP is up 36% since the pre-recession peak in 2007.
So net private investment is limp, and net public investment is struggling to keep one nostril above water. This has a lot to do why it feels like things are falling apart, and not just in rural America. An important section of the Brooklyn–Queens Expressway is about to fall down, and there are many other similar cases across the country. Visitors from China routinely express shock about the state of the infrastructure in a country that is still far richer than theirs. And crises like the coronavirus really bring home the effects of inadequate public and private investment. Tending to long-lasting things has gotten highly unfashionable, but that approach has some pitfalls.