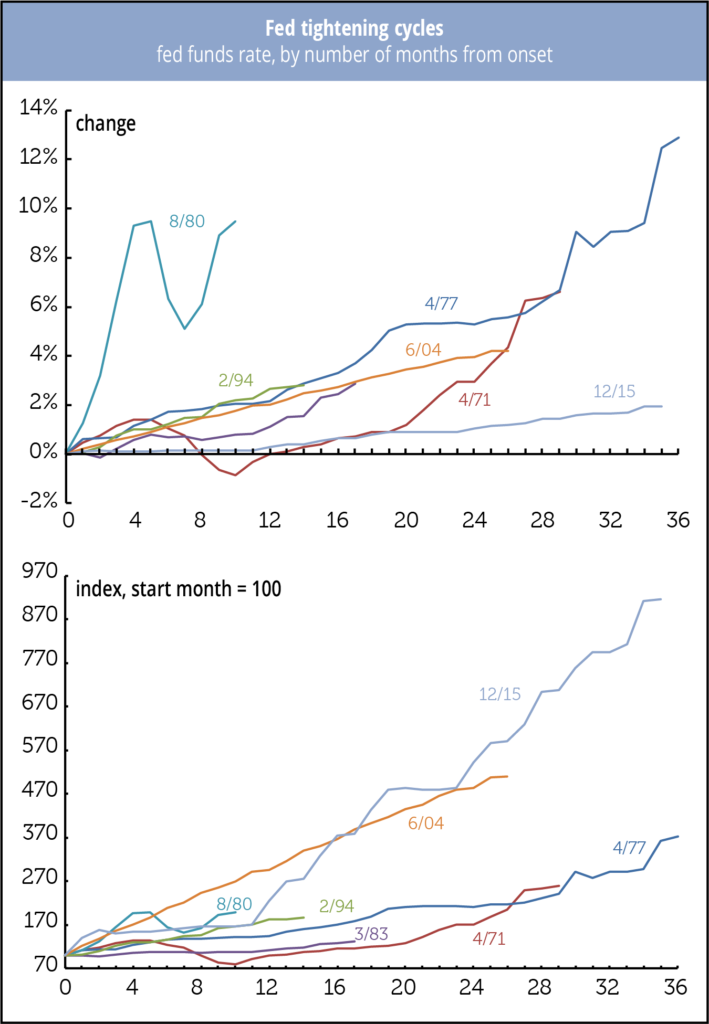
Rising interest rates probably won’t help the startup series, outlined below, head northward. How does the current tightening cycle stack up against earlier instances?
Longer and mostly milder, in a phrase.
Over the last 35 months, since the tightening began in December 2015, the fed funds rate is up 196 bps. The average of the previous six cycles shown is 648 bps over 22 months, though the range in both magnitude and duration is wide.
But the current rise in rates is starting from a very low level (0.24%). The previous low starting point was 1.03% in 2004; the average, excluding the recent cycle, is 5.26%. If we look at the percentage (not percentage point) rise from the starting point, we get a very different picture. The bottom graph indexes the fed funds rate in the base month to 100. By that measure, the current cycle is the winner, with a current index value of 917. In second place is the 2004 cycle with a maximum value of 510. The average of all the previous cycles, again excluding the current one, is 277.
So, while the current round of tightening looks mild if you look at the level and change in nominal rates alone—a mildness accentuated by the slow pace of tightening—the change from record low interest rates to something more normal is nothing to sneeze at. A stumbling stock market is the least we can expect if this continues as it’s likely to.


