Since disinflation, flirting occasionally with deflation, took over the economic scene in the early 1980s, there have been a few “inflation is back!” scares. How do current concerns stack up?
Price measures in the ISM reports confirm the verbal alarm expressed by respondents recently. The manufacturing price index was 89.6 in April; services, 76.8. Manufacturing is at the 98th percentile in the series’ history (which begins in 1948); services, at the 99th (a much shorter series—it begins in 1997). But, as the graph on the top of p. 4 shows, we’ve been here many times before. We’ve graphed only manufacturing, below, because of its much longer history. The services index traces a path very similar to manufacturing since it began in 1997; the correlation coefficient is 0.82.

Oddly, the low-inflation era since the early 1980s looks little different from the rising inflation era before it. That cautions against drawing any trend conclusions from the high current readings. But, over the last twenty years, the two price indexes do track moves in the CPI pretty well. Here’s a graph of the actual yearly change in the CPI against one predicted by the ISM services price subindex.
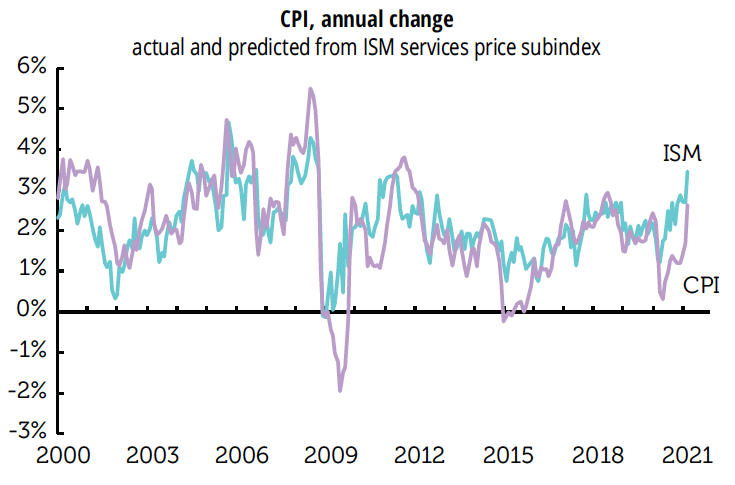
It’s suggesting that the CPI “should” be rising at a 3.5%, almost a full point above where it was in March, and considerably above the Fed’s 2.0% target (though that target looks to be in abeyance, at least for now).

