Consumer Credit: Demand & Availability Take a Hit
Consumer credit demand and availability took a sharp hit in recent months, according to the New York Fed’s latest Credit Access Survey. The hit was sharpest in credit cards, followed by auto loans. Mortgage refinancing, especially for creditworthy borrowers, was an exception to the trend.
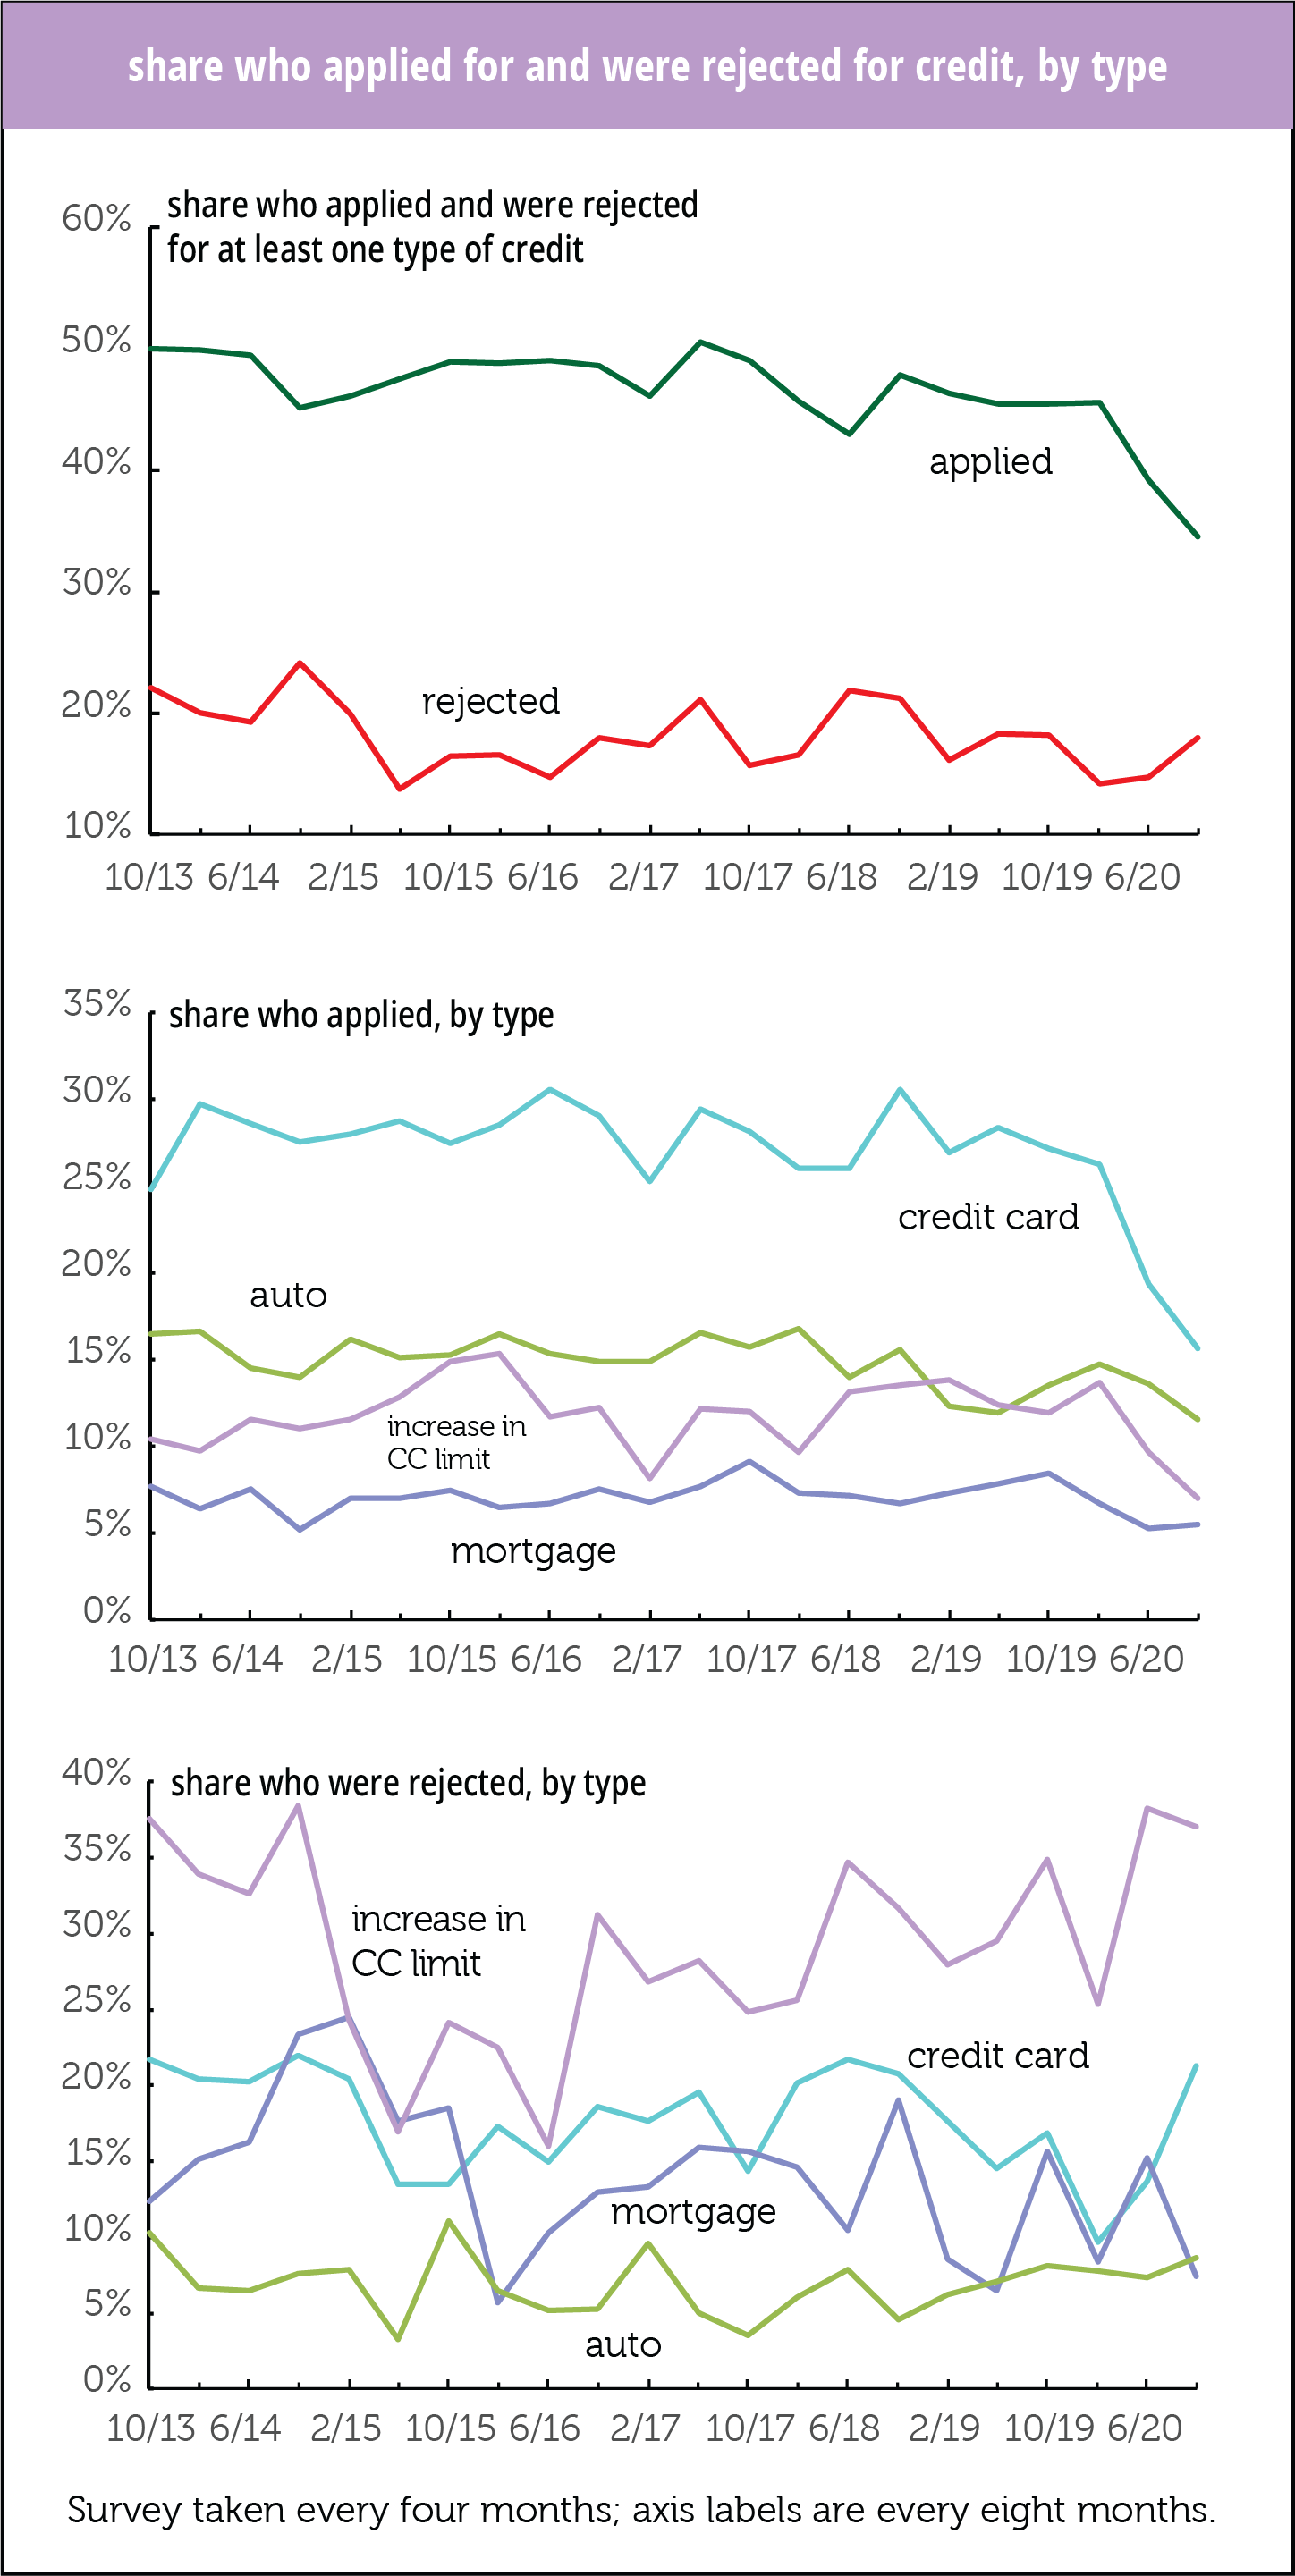
In the four months ending in October, just 35% of surveyed consumers applied for one or more types of credit, down from 39% in the four months ending in June, and the 46% average for 2018–2019. The pullback was broad-based across age and credit score groups. Despite the decline in applications, the rejection rate for at least one type of credit rose from 15% to 18%, though that 18% is little different from the 19% average of 2018–2019. (See first graph below.) Rejections were highest for applicants with credit scores below 680. As the New York Fed points out in its write-up of the findings, these results are consistent with the Fed’s latest loan officer survey, which showed a tightening of lending standards on consumer credit.
The pullback in applications and rise in rejections was sharpest in credit cards, both for new applications and raising of existing limits. (Second and third graphs below.) Just 16% of respondents applied for a new credit card, down from 19% in the previous period, and the lowest since the series began in 2013. Application for higher credit lines fell from 10% to 7%, a series low, and just over half the series average of 12%. A substantial 37% of the applications were rejected, down from the previous period’s 38%, the series high. Applications for mortgages were steady at 5%, tying the low for the series—though rejections were also at a low.. Just 12% of respondents applied for an auto loan, tying the series low, and 9% were rejected, at the high end of the series’ historical range.
Not graphed, to avoid visual overcrowding: applications for mortgage refinancing. Those rose to 16% of households in October, its highest level in seven years. The 6-point rise from February was driven by consumers with credit scores above 760.
Consumers mostly expect credit card availability to remain tight, especially among those with low credit scores. Expectations of availability for other kinds of credit are within historical norms, however.
Households are concerned about meeting unexpected expenses. Just two-thirds, 66%, of households thought they could come up with $2,000 in a pinch, a series low, and down from 70% in 2019.
Tight credit card conditions will probably be a drag on spending in the coming months, especially if the job market recovery continues to cool. But housing finance looks secure for now, especially for high-end borrowers.


Microscopic atmospheric particles & Pioneer 10
Alexander Morse, researcher at Rockefeller Institute, reports CO₂ emissions will fall 5% this year. CO₂ has fallen by 20% in Wuhan, while microscopic atmospheric debris fell by 71% since March 24th in India.
Neither Morse, nor we, are suggesting this is the solution to our ecological problems, or that we focus on anything outside health and relief right now, but such a dramatic reduction is important knowledge.
(Pioneer 10’s images of Jupiter, from NASA, where everything is free.)
For the future, we could try carbon-cost programs. Some estimates of social costs per ton run to $400: The Obama administration estimated between $42 to $62 per ton; the Trump administration between $1 to $7 per ton.
So let’s turn to the states, where initiatives have generated about 50% of growth in renewables. And not a zero sum: Between 1970 and 2017 a witch’s brew of pollutants fell by 73%, while GDP grew by 270%.
If you can see the western sky this evening, look for red giant Alderbaran blazing to the left of Venus.
If all is well, Pioneer 10, launched in 1972 & last heard from across 7.6B miles in 2003, is still heading out. Weighing <600 pounds, carrying pictures of a man & a woman, the solar system, and how to find us relative to 14 pulsars, it should pass Aldebaran in 2 million years. We know how to do this stuff. Analysis here: https://rockinst.org/blog/coronavirus-has-improved-air-quality-what-does-that-mean-for-climate-policy/ Cool graphic: https://www.space.com/nasa-satellite-air-pollution-us-northeast-coronavirus.html