Articles by: admin

New Trends: EPOPs

There’s evidence of new trends in the employment/population ratios (EPOP), the wages of production workers, and in the expectations components of the University of Michigan confidence surveys: trends are stronger and views are brighter among those with lower levels of education, and recently wage gains for supervisory workers are dragging behind those of production workers in all but four sectors.

As we and many other analysts have noted, despite a very low unemployment rate, improvements in the employment/population ratio (EPOP) have been much less impressive. Part of this reflects an aging population, though not all. Our guess is that just over two-thirds of the gap between the early 2000s peak and the present is the result of an aging population. We’ve looked at some of those explanations in the past and will again for sure.

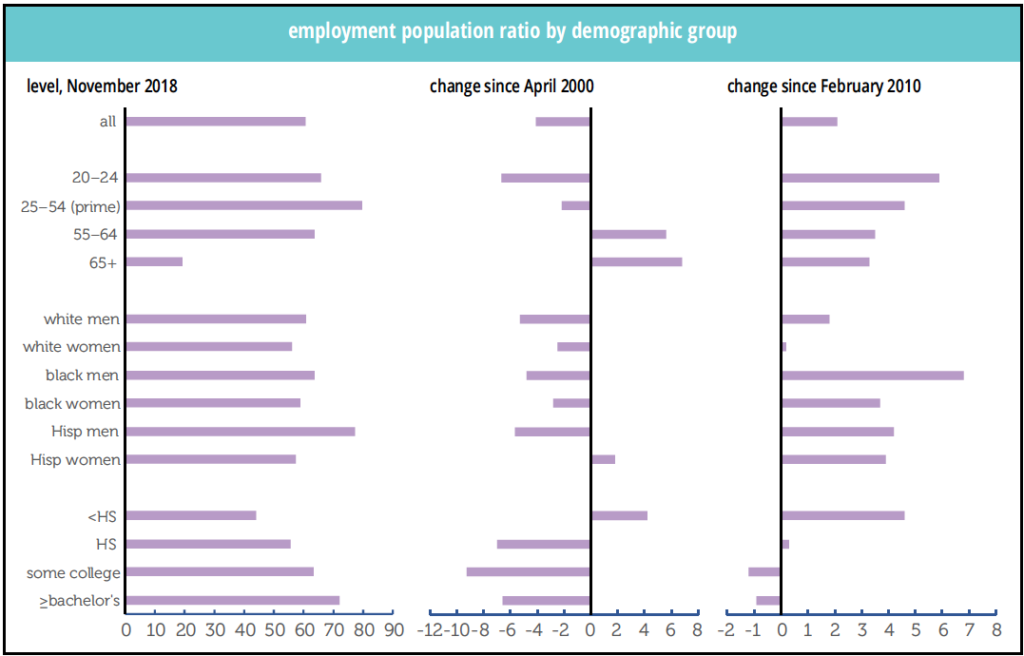
But what interests us now are movements in EPOPs by demographic group, as shown in the graphs below. Since the all-time peak in the EPOP in April 2000, the overall figure is down 4.1 points. Younger adults have been especially hard-hit (which is one reason the aging population story is an incomplete explanation)—though many of them are staying in school. But even prime-age workers are down. Older workers, however, have gained (though their levels are much lower than their younger counterparts).

Broken down by race and sex, only Hispanic women have a higher EPOP than they did in April 2000; Hispanic men are way down. Women overall have seen much smaller declines than men in their demographic group. By education, only those with less than high school have gained (though they’re a small and shrinking part of the workforce—7% now, compared to 10% in 2000). EPOPs among the more educated are down.

The story is somewhat different if we measure changes from the post-Great Recession low in the job market, February 2010. The overall EPOP is up 2.1 points, with all age groups participating, and the younger doing better than the older. Blacks and Hispanics of both sexes have done much better than whites. The education breakdown is striking though: those who didn’t finish high school have seen the strongest improvement in their EPOP, up nearly 5 points. Those with some college or a bachelor’s or higher have seen their EPOPs decline. This is not what you might expect. Since those with some college account for 26% of employment and with a bachelor’s or higher, 42%, the less educated third of the population have been doing a lot of work driving the overall EPOP higher over the last almost-nine years—with some assistance from the 20–24 set, who are not counted in the educational attainment EPOPs. We’re happy to see improvement for those with lower levels of education, but it’s something new.

by admin· · 0 comments · TLR Wire, Uncategorized

New Trends: Wages, Sectors, & Workers

Something new here too. Since 2006 wage gains among production workers are stronger than for all workers in all but four sectors, which suggests, of course, that managers are falling behind.

The Bureau of Labor Statistics has wage data for manufacturing production workers running back to 1939. In 1939, average hourly earnings for nondurable manufacturing were just 52% of those for durable manufacturing, 34 vs. 65 cents, but rose almost straight up in the 1940s to 80% and continued to drift up to their current 89%.

In the Trade, Transportation and Utilities sector, however, retail wages have lost ground, falling from 84% of TTU wages, to 80% currently, while wages for transportation & warehousing have fallen from 127% to 110%. Wages for wholesale trade have risen from 109% of TTU wages to 126%, while utility workers have seen their wages climb from 132% to 184%.

Back in 1964, when records were established for the goods producing and service providing sectors, wages were even, but by the 1980s wages for services had slipped to 80% of goods. They began a rocky climb back up and have levelled out at about 94% currently. Since 1964, construction and manufacturing wages have risen by similar percentages, but logging & mining wages have gained an additional fifteen percentage points.

We’re looking back to 2006 now because that is as far back as the all-worker series goes. Since then, wages in logging and mining have made the strongest gains, up 49%, to $28.96, followed by leisure & hospitality, up 47% to $14.11. Production workers in finance and in professional & business services made similar percentage gains, to about $27.00, as did construction work, to about $28.00. Since 2006, wages in services are up 40% and in goods up 36%.

Weakest gains for production workers are in manufacturing, transportation & warehousing, and retail trade, all up around 30% to $21.77, $22.07, and $16.15 for retail.

Since 2006, however, production workers have seen greater wage gains than all workers in all but four sectors, so managers are dragging that broad tranche down. In manufacturing production workers lagged all workers by 1 percentage point, in durable manufacturing by 3pps, in utilities by 5pps, and in information by 11pps. In leisure & hospitality, production workers were 6pps ahead; in retail trade, 5pps; and in logging & mining, construction, and education & health, all ahead by 4pps.

Over the last year, production workers wages are up over 5% in logging & mining, up 4% or more in information, retail trade, leisure & hospitality, and construction. In only other services, 1.9%, and finance, 1.6%, are they up less than 2 percent.

Over the last year wages for all workers in information, a struggling sector by other measures, are up 6%, up 4% or more in construction, retail trade, leisure & hospitality, and finance, followed by a string of 2-3% gains, with non-durable manufacturing, and transportation & warehousing reporting the weakness growth at 1%.

The wage picture is certainly complicated, with some of the largest percent gains occurring side by side between the highest and the lowest hourly wages, and quite a few “not as we expected” trends. By a number of metrics the different sectors are going in different directions, which further confuses an already cloudy picture.

by admin· · 0 comments · TLR Wire, Uncategorized

New Trends: Education and Party in Michigan

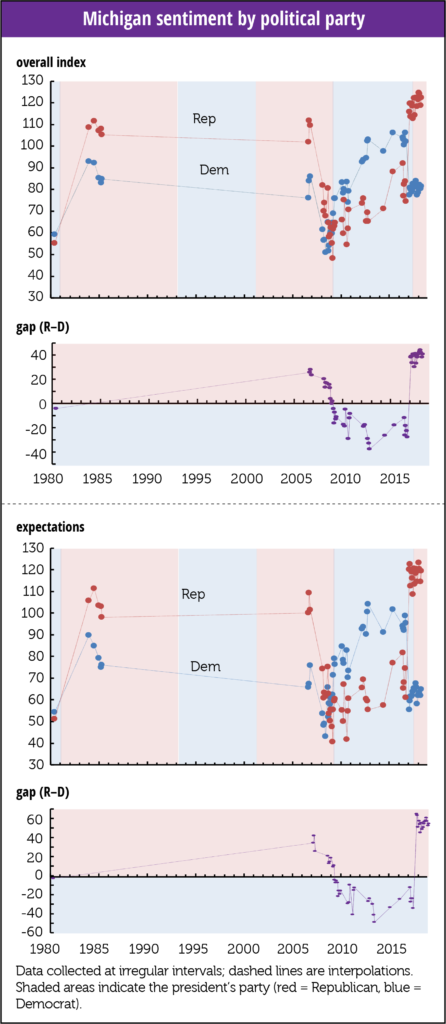
First, party: The University of Michigan collects data by political party only sporadically, so we don’t have a full history but, as we brought up at the time, last May, Richard Curtin, the guy who puts it all together, noted that in fifty years, the survey had never recorded as “dominant a political effect,” as it did in early 2017. Curtin expected that divergence to converge, but instead it widened.

Here’s the graph we ran:

During the years Trump has been President, Republican sentiment has averaged 117.6; while that of Democrats averaged 80, meaning Republican sentiment is running 46 points above the Obama years, while sentiment among Democrats is running just 13 points below. Both calculations exclude the depth of the recession years, when the divergence straitened to just 9 points; whoever thought we’d remember anything reassuring about those years.

That effect continues. In an October presentation Dr. Curtin identified his “major underlying issue,” as whether economic expectations surveys can retain their predictive ability given their “responsiveness to political rather than economic developments.” He quotes some observers who believe the partisan effect is “uniquely tied to the Trump administrations,” but his research suggests it is tied to our old friends income inequality and wage stagnation.

Second, educational attainment: Curtin also revisited the fact that the partisan divide between those with college-degrees remains “very low and insignificant,” and built on the striking observation he made back in May: the demographics really changed in 2017. Through 2016, generally, assessments of economic possibilities rose with income and education, and fell with age.

That changed in 2017.

Overall expectations for those with less than a high school degree had risen from 68 in October 2016 to 82 by August 2017, but fell for those with a college degree from 87 to 80. For those 65+ they rose from 2016’s 69 to 83 in 2017, while slipping a bit, to 86, for those 18 to 34 years old.
May 14, 2018
Sentiment for all three education terciles tracked each other closely throughout the series, all peaking around 2000, high school at 100 and the two college groups at 120, before falling raggedly to about 60 in the recession. The current divergence is led by an increase in the outlooks of the two lower attainment levels while those with a college degree are basically flat.

Curtin suggests that those with “relatively low job skills, as proxied by education, were the most affected by Trump’s election.” As we mentioned when we first brought this up, it’s a good thing if people with lower skills can do better.

But it’s a very bad thing if partisanship is putting a dent in the value of formerly trusted economic data.

by admin· · 0 comments · TLR Wire, Uncategorized

New Trends: Education and Party in Michigan

First, party: The University of Michigan collects data by political party only sporadically, so we don’t have a full history but, as we brought up at the time, last May, Richard Curtin, the guy who puts it all together, noted that in fifty years, the survey had never recorded as “dominant a political effect,” as it did in early 2017. Curtin expected that divergence to converge, but instead it widened.

Here’s the graph we ran:

During the years Trump has been President, Republican sentiment has averaged 117.6; while that of Democrats averaged 80, meaning Republican sentiment is running 46 points above the Obama years, while sentiment among Democrats is running just 13 points below. Both calculations exclude the depth of the recession years, when the divergence straitened to just 9 points; whoever thought we’d remember anything reassuring about those years.

That effect continues. In an October presentation Dr. Curtin identified his “major underlying issue,” as whether economic expectations surveys can retain their predictive ability given their “responsiveness to political rather than economic developments.” He quotes some observers who believe the partisan effect is “uniquely tied to the Trump administrations,” but his research suggests it is tied to our old friends income inequality and wage stagnation.

Second, educational attainment: Curtin also revisited the fact that the partisan divide between those with college-degrees remains “very low and insignificant,” and built on the striking observation he made back in May: the demographics really changed in 2017. Through 2016, generally, assessments of economic possibilities rose with income and education, and fell with age.

That changed in 2017.

Overall expectations for those with less than a high school degree had risen from 68 in October 2016 to 82 by August 2017, but fell for those with a college degree from 87 to 80. For those 65+ they rose from 2016’s 69 to 83 in 2017, while slipping a bit, to 86, for those 18 to 34 years old.

Sentiment for all three education terciles tracked each other closely throughout the series, all peaking around 2000, high school at 100 and the two college groups at 120, before falling raggedly to about 60 in the recession. The current divergence is led by an increase in the outlooks of the two lower attainment levels while those with a college degree are basically flat.

Curtin suggests that those with “relatively low job skills, as proxied by education, were the most affected by Trump’s election.” As we mentioned when we first brought this up, it’s a good thing if people with lower skills can do better.

But it’s a very bad thing if partisanship is putting a dent in the value of formerly trusted economic data.

by admin· · 0 comments · TLR Wire, Uncategorized

Comments on December employment

Back when John Liscio was alive, we used to joke with him about using a New York Post style headline, “Job shocker!” This month’s report would qualify.

• Employers added 312,000 jobs in December, 301,000 of them in the private sector. The headline gain was 122,000 above the average of the previous three months, even after the upward revisions to October and November. Though it looks giant by recent standards, the monthly gain in percentage terms was only at the 60th percentile of all months since 1950. It looks better if you start the clock at 1980: then, December’s gain is at the 73rd percentile. Over the year, total employment was up by 1.8%, the highest since 2016. It had been sagging through 2017 and early 2018, but has largely recovered.

• Gains were widespread across sectors. Mining and logging were up 4,000 (slightly below the sector’s average over the last year); construction, 38,000 (well above average, with heavy/civil unusually strong); manufacturing, 32,000 (a third above average, with nondurables in the lead); wholesale trade, 8,000 (slightly above average); retail, 24,000 (three times its average, with a large contribution from general merchandise); transportation and warehousing, 2,000 (way below average, with hard-to-adjust couriers down 5,000); finance, 6,000 (a third below average); professional and business services, 43,000 (a bit below average); education and health, a boffo 82,000 (the health subsector was half again above its average, but private education, apparently enjoying its liberation from federal investigation, up over five times its average); leisure and hospitality, 55,000 (more than twice its average, enjoying a boost from the returning Marriott strikers and a strong performance by bars and restaurants); and other services, 8,000 (somewhat above average). The only major sector in the red: information, down 1,000, in line with its average. Government added 11,000, well above average, with more than all the gain coming from state and local; federal employment was down. (This was all before the federal government shutdown.)

• November’s gain was revised up by 21,000, and October’s by 37,000. The combined total of 58,000 largely came from concurrent seasonal adjustment distributing December’s “surprise” backwards. Before seasonal adjustment, the combined gains in October and November were revised up 12,000; adjustment pushed that up to 58,000.

• Unsurprisingly, diffusion indexes were strong, with all intervals up to levels not only above their 2017 averages, but above the mighty 1995–2000 averages as well.

• The workweek rose 0.1 to 34.5, its level for eight months of 2018.

• Average hourly earnings were up 0.4% for both all workers and nonsupervisory workers. For the year ending in December, the all-worker series was up 3.2%, matching October; the latest readings are the highest we’ve seen since 2009. No major sector showed a decline, and a couple were quite strong, notably retail, up 1.1% for the month and 5.0% for the year.

• The household survey was less exuberant. Total employment was up 142,000. When adjusted to match the payroll concept, household employment was up a more modest 180,000. On a yearly basis, which is a much better way to look at this volatile series, adjusted employment was up 1.8%, exactly in line with its payroll counterpart. Employment growth lagged the increase in the labor force, which was up 419,000. Consequently, the participation rate rose by 0.2, to 63.1%, its highest level in nearly five years, but the employment/population ratio was unchanged at 60.6% for the third consecutive month. Part-time employment was up by 159,000, though all of it came from the willing, up 305,000; those working part-time for economic reasons fell by 146,000. Unwilling part-timers accounted for 3.0% of employment, which is pretty much where the share has been since June.

• The number of unemployed rose by 276,000, and the rate rose 0.2 to 3.9%, its highest level since June. Because of separate seasonal adjustment, the component of the unemployed don’t add to the total, but voluntary leavers, a proxy for the quit rate, accounted for a big chunk of the increase, though the strong message of that number was countered by a relatively large number of permanent job losers. All durations of unemployment showed an increase except the very shortest, less than five weeks; the median and mean durations both rose 0.1 point, though they’re still at the low end of their recent ranges. The broad U-6 rate was unchanged at 7.6%. It’s up 0.2 since August.

• The age distribution of employment gains is curious. Given the volatility of the month-to-month figures in the household survey, we’ll look instead at changes for the year ending in December. Of the 2.9 million jobs gained over the year, nearly half, 49%, came from workers aged 55 and over, over twice their share of the workforce. Prime-aged workers, those aged 25–54, who account for nearly two-thirds of the workforce, or 64% to be precise, accounted for less than half the gains (45%). Their contribution was dragged down by the older group within that cohort, as the number of those aged 45–54 actually declined. Those aged 35–44 showed gains slightly smaller than their share of the workforce, while the youngest subgroup, 25–34, were up strongly. Also over-represented in the gains: older teens, those aged 18–19; just 2% of the workforce, they accounted for 11% of the year’s gains.

• Job flows numbers lacked drama, with all categories showing little change. One bright spot: the three-month month moving average of the share of the unemployed dropping out of the labor force—a lingering blemish on the expansion—fell to just 1.1%, matching the series all-time lows, set in late 2000.

Strong employment gains (at least in the establishment survey) and strong wage gains would normally excite some trigger fingers at the FOMC, though recent financial market turmoil might calm the itch (as Powell’s speech this morning suggests). With aspects of this expansion that look quite long in the tooth, you can’t not be impressed by these numbers.

by admin· · 5 comments · Employment & Productivity