There’s evidence of new trends in the employment/population ratios (EPOP), the wages of production workers, and in the expectations components of the University of Michigan confidence surveys: trends are stronger and views are brighter among those with lower levels of education, and recently wage gains for supervisory workers are dragging behind those of production workers in all but four sectors.
As we and many other analysts have noted, despite a very low unemployment rate, improvements in the employment/population ratio (EPOP) have been much less impressive. Part of this reflects an aging population, though not all. Our guess is that just over two-thirds of the gap between the early 2000s peak and the present is the result of an aging population. We’ve looked at some of those explanations in the past and will again for sure.
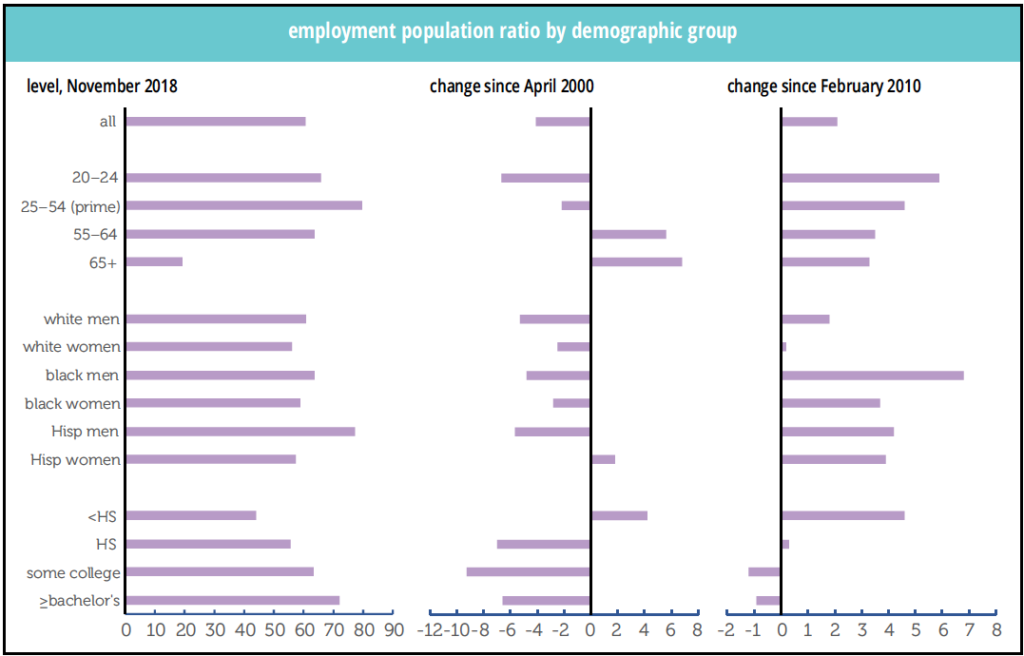
But what interests us now are movements in EPOPs by demographic group, as shown in the graphs below. Since the all-time peak in the EPOP in April 2000, the overall figure is down 4.1 points. Younger adults have been especially hard-hit (which is one reason the aging population story is an incomplete explanation)—though many of them are staying in school. But even prime-age workers are down. Older workers, however, have gained (though their levels are much lower than their younger counterparts).
Broken down by race and sex, only Hispanic women have a higher EPOP than they did in April 2000; Hispanic men are way down. Women overall have seen much smaller declines than men in their demographic group. By education, only those with less than high school have gained (though they’re a small and shrinking part of the workforce—7% now, compared to 10% in 2000). EPOPs among the more educated are down.
The story is somewhat different if we measure changes from the post-Great Recession low in the job market, February 2010. The overall EPOP is up 2.1 points, with all age groups participating, and the younger doing better than the older. Blacks and Hispanics of both sexes have done much better than whites. The education breakdown is striking though: those who didn’t finish high school have seen the strongest improvement in their EPOP, up nearly 5 points. Those with some college or a bachelor’s or higher have seen their EPOPs decline. This is not what you might expect. Since those with some college account for 26% of employment and with a bachelor’s or higher, 42%, the less educated third of the population have been doing a lot of work driving the overall EPOP higher over the last almost-nine years—with some assistance from the 20–24 set, who are not counted in the educational attainment EPOPs. We’re happy to see improvement for those with lower levels of education, but it’s something new.


