Articles by: admin

A Metaphor Unlikely to Deliver: Betting on H20

Michael Hiltzik has a piece buried in this morning’s Los Angeles Times, with the catchy title, “Wall Street Can Now Bet on the Price of California Water: Watch Out,” but more staid content.

Amid questions about how such an index would work “anywhere outside California,” he mentions that people who have tried to make money from California water rates have often lost their shirts. In one such plot, Texas’s Bass brothers fell far short of their goal of $92 million in revenue in the first year when they bought farmland in California’s Imperial Valley, which entitled them to buy water at a federally subsidized $12.50 an acre-foot. The plan was to let the land lie fallow and sell the water to thirsty San Diego at $400.00 an acre-foot. Not so said the Metro Water District amid public uproar, and the Bass brothers sold off the land, making a profit, but.

Those who put together the index claim it’s “doing good,” and Hiltzik says they are correct on the locking in of prices for farmers, “as far as it goes.”

To him, the problem is not the speculation, it’s that an index can’t address the underlying causes of water scarcity, including climate change and wasteful agricultural practices, which are expected to deteriorate further.

Another problem we’re underscoring—it probably won’t make headlines—is a potential hit to our beleaguered, bottom-line essential agricultural workers. Hiltzik suggests that using markets to try to manage things like water shortages excludes certain affected players who can’t participate, in this case, the environment, and farmworkers. If farmers are in the position where they are better leaving their fields fallow and selling their water, the farmworker is “out of luck.” And a job.

Ellen Hanak, water expert at the Public Policy Institute of California who pointed out the missing shirts above, also cautioned that water is a “heavy commodity with a lot of restrictions on how it can be moved… People talk about water as the new gold, but that’s just a metaphor.”

Cormorants on Malibu Lagoon

by admin· · 0 comments · Red Flags

Racial & Ethnic Disparities in EPOP Recoveries

Employment-population ratios have been recovering: the overall EPOP had regained 54.1% of its February-April loss by September, and 62.2% through December. However, in the last two months only half the major demographic groups retained traction, so November and December overall were flat.

That’s graphed below, and here are some highlights: Men overall have gained 5.2 points of their loss, about half women’s 10-point recovery. White & Hispanic women have turned in stronger performances than men, contradicting a popular meme that played off women’s weakness in December.

Women’s EPOP fell by 10 points between February and April, and has regained 6.4%. Men lost 9.6 points and regained 5.7. But since women started with a lower EPOP than men, these translate to larger percentages. However, in December the EPOP for women was 83% of that of men, close to February’s share, after having fallen to 80% at the April low.

Racial and ethnic disparities are far greater than those of gender. Black and Latino EPOPs fell harder than whites’ and have recovered less, with black women showing the weakest recovery of any of the demographic groups shown. One thing dragging down the recovery among black workers is almost certainly the continuing decline in government employment, where they’re heavily overrepresented, with many jobs earning good pay.

by admin· · 0 comments · Employment & Productivity

Manufacturing, Women & Labor Pain

It was encouraging to see solid gains in manufacturing & construction in the most recent payroll numbers, occupations listed as more stable, and therefore safer. Back in spring the idea was to get such work rolling again, while skipping the stop at a bar on the way home. We’re hitting the reset button on that.

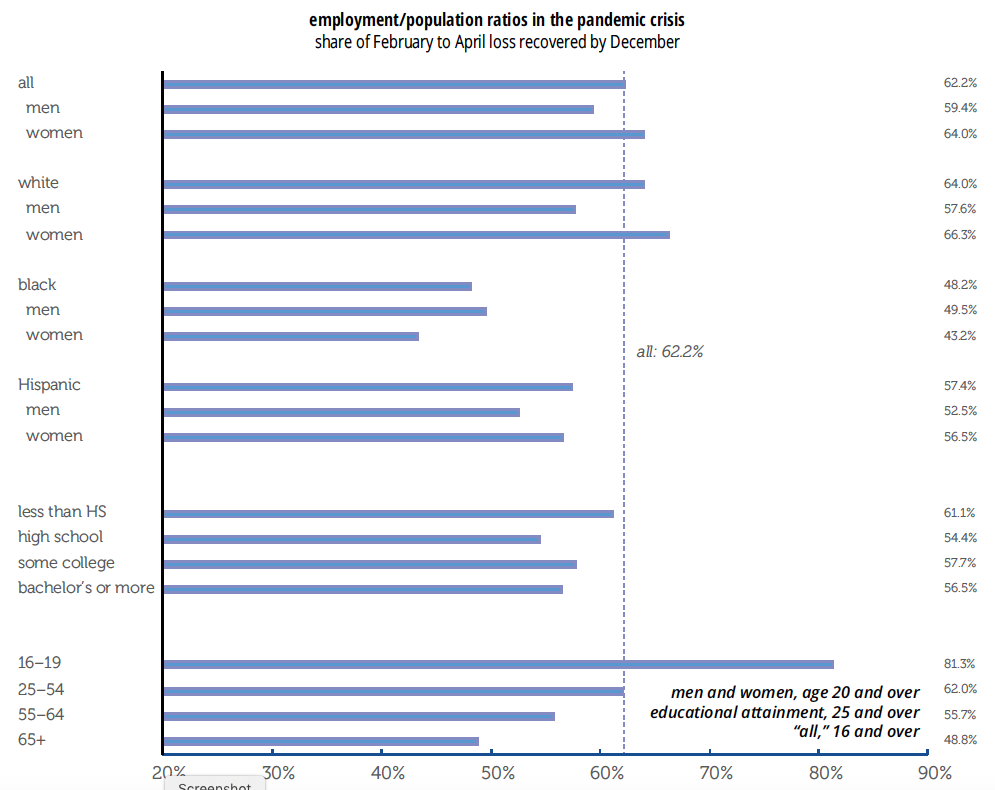
That may help get the pandemic under control, but it is going to hurt minority workers, as shown in Friday’s jobs report. The Household survey is jumpy, but the number of employed men rose, while the number of employed women fell. Within that both White and Black men gained jobs, as did White women, but Black women lost jobs, as did both sets of Latinx workers, and Asians, not broken out by sex. Gains were large enough to lift employment-population ratios for White women and Black men, while losses were enough to cause declines for Black women, Asians, and for Latinx men and women.

In 2019 women held 29% of manufacturing jobs and, within that, 39% of medical manufacturing and animal processing, 46% of sporting goods & toy manufacturing, and a little over half of textile manufacturing. Asian workers had a 7% share, but 29% of computer equipment; Blacks, 10%, and close to 20% of auto and pulp manufacturing; and Latinx, 17%, including 40% of fruit and vegetable preservation. Both Black and Latinx workers have close to 20% share in tire manufacturing, and 22% and 35% shares in animal processing plants.

Manufacturing employment is still down 4% over the year, less than overall employment’s -6%. We sometimes include a graph of the three-month average of manufacturing withholding in a classic Midwestern state. Here’s what that looks like these days:

by admin· · 0 comments · Comments & Context

Consumer Credit: Demand & Availability Take a Hit

Consumer credit demand and availability took a sharp hit in recent months, according to the New York Fed’s latest Credit Access Survey. The hit was sharpest in credit cards, followed by auto loans. Mortgage refinancing, especially for creditworthy borrowers, was an exception to the trend.

In the four months ending in October, just 35% of surveyed consumers applied for one or more types of credit, down from 39% in the four months ending in June, and the 46% average for 2018–2019. The pullback was broad-based across age and credit score groups. Despite the decline in applications, the rejection rate for at least one type of credit rose from 15% to 18%, though that 18% is little different from the 19% average of 2018–2019. (See first graph below.) Rejections were highest for applicants with credit scores below 680. As the New York Fed points out in its write-up of the findings, these results are consistent with the Fed’s latest loan officer survey, which showed a tightening of lending standards on consumer credit.

The pullback in applications and rise in rejections was sharpest in credit cards, both for new applications and raising of existing limits. (Second and third graphs below.) Just 16% of respondents applied for a new credit card, down from 19% in the previous period, and the lowest since the series began in 2013. Application for higher credit lines fell from 10% to 7%, a series low, and just over half the series average of 12%. A substantial 37% of the applications were rejected, down from the previous period’s 38%, the series high. Applications for mortgages were steady at 5%, tying the low for the series—though rejections were also at a low.. Just 12% of respondents applied for an auto loan, tying the series low, and 9% were rejected, at the high end of the series’ historical range.

Not graphed, to avoid visual overcrowding: applications for mortgage refinancing. Those rose to 16% of households in October, its highest level in seven years. The 6-point rise from February was driven by consumers with credit scores above 760.

Consumers mostly expect credit card availability to remain tight, especially among those with low credit scores. Expectations of availability for other kinds of credit are within historical norms, however.

Households are concerned about meeting unexpected expenses. Just two-thirds, 66%, of households thought they could come up with $2,000 in a pinch, a series low, and down from 70% in 2019.

Tight credit card conditions will probably be a drag on spending in the coming months, especially if the job market recovery continues to cool. But housing finance looks secure for now, especially for high-end borrowers.

by admin· · 0 comments · Red Flags

Microscopic atmospheric particles & Pioneer 10

Alexander Morse, researcher at Rockefeller Institute, reports CO₂ emissions will fall 5% this year. CO₂ has fallen by 20% in Wuhan, while microscopic atmospheric debris fell by 71% since March 24th in India.

Neither Morse, nor we, are suggesting this is the solution to our ecological problems, or that we focus on anything outside health and relief right now, but such a dramatic reduction is important knowledge.


(Pioneer 10’s images of Jupiter, from NASA, where everything is free.)

For the future, we could try carbon-cost programs. Some estimates of social costs per ton run to $400: The Obama administration estimated between $42 to $62 per ton; the Trump administration between $1 to $7 per ton.

So let’s turn to the states, where initiatives have generated about 50% of growth in renewables. And not a zero sum: Between 1970 and 2017 a witch’s brew of pollutants fell by 73%, while GDP grew by 270%.

If you can see the western sky this evening, look for red giant Alderbaran blazing to the left of Venus.

If all is well, Pioneer 10, launched in 1972 & last heard from across 7.6B miles in 2003, is still heading out. Weighing <600 pounds, carrying pictures of a man & a woman, the solar system, and how to find us relative to 14 pulsars, it should pass Aldebaran in 2 million years. We know how to do this stuff. Analysis here: https://rockinst.org/blog/coronavirus-has-improved-air-quality-what-does-that-mean-for-climate-policy/ Cool graphic: https://www.space.com/nasa-satellite-air-pollution-us-northeast-coronavirus.html

by admin· · 0 comments · Comments & Context