…and that’s exactly how I’m paid.” Johnny Paycheck
If it’s so hard to find workers…
The Bureau of Labor Statistics announced in August that real hourly earnings were down 0.1% for all employers in July (+0.3% in earnings +0.3% increase in CPI for urban consumers, and rounding—more on that in a bit), and real weekly earnings were down 0.3%, adding in the 0.3% decrease in the average workweek.
Over the year, real hourly earnings were up 1.3%, but the workweek was down 0.3%, and average weekly earnings were up just 0.8%.
For production and non-supervisory workers, real hourly earnings were down 0.2% in July (+0.2% in earnings and +0.4% in the price index for Urban Wage Earners and Clerical Workers), and weekly earnings were down 0.5% in the month, adding in the decline in the workweek. Over the year, real earnings were up 1.6%, but a 0.9% decline in the workweek spiked that down to +0.7% in weekly wages.
It’s tough getting used to a falling workweek—it was so easy just to leave 34.5 hours circled on the forecast spreadsheet—but the declines seem to be real and persistent, and not just coming from the sectors one would expect, like retail, which has been falling for decades. The Bureau of Labor Statistics has, of course, added in specific sectoral detail to their releases over time and, as one would expect, the goods-producing sectors were the first to come online.
We started the graphs below in 1965 for consistency’s sake, though manufacturing goes back all the way back to 1941 (and some sectors don’t begin until 1972). World War II really shows up in the early years of the series, when the workweek exceeded 45 hours, but it fell back towards 40 with demobilization. It’s too bad we can see what other sectors looked like back then.
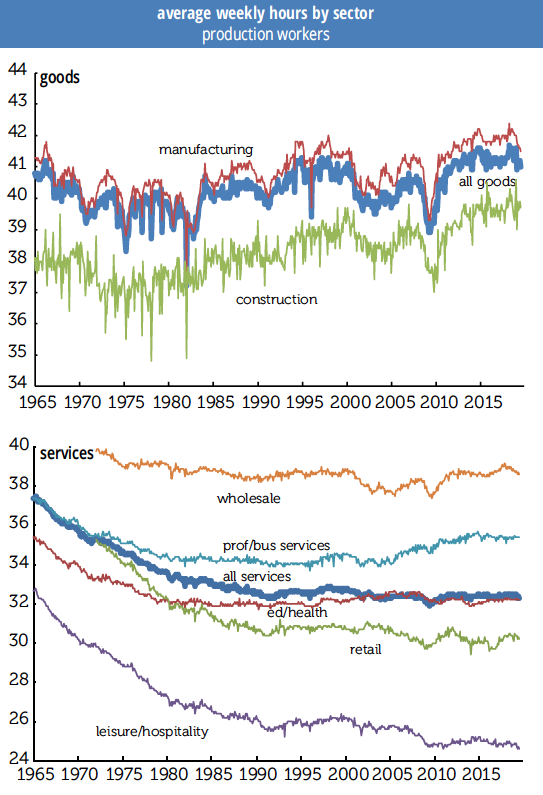
Please note the difference in hours worked in the graphs: the goods sector shows no long-term decline, leisure & hospitality is low and weakening, and the split between wholesale and retail trade widening, for obvious reasons.
The all-workers series starts in 2006, so we didn’t use it for graphing, but we did compare recent performance of the all workers and production work weeks. For private service-providing workers, the production side lost 0.3 hour in 2014 but all workers did not, meaning supervisory hours were up, but recently they have moved together, although production workers’ week is 6 minutes longer.
Production workers hours are more jagged in the logging and mining sector and have seen some declines that don’t show up in all hours. (Logging and mining isn’t graphed, because things were getting crowded.) Also, production workers’ hours, at 47.2, are below their 2014 peak of 47.9, while all workers’ weeks are longer than they have been since 2006. In manufacturing, production hours’ slide from 42.4 to 41.5 since April 2018 is a bit steeper than all worker’s decline, but in retail trade, oddly, production workers’ hours have risen 8/10s to 30.2 while all workers fell from 31.8 hours to 30.7.
In leisure & hospitality, all workers are half an hour above their prior trough while production workers are below, and in bars & restaurants production workers are now slipping in a modest jagged way, but still up about half an hour from the 2010 trough, while all workers are slightly down.
The two series travel together in construction, and in education & health, although, you guessed it, health care hours are stronger than education hours. One could make a “we don’t need no education” crack about that, but since there are a lot of people working for those “under federal investigation” for-profit outfits on that line, we’ll raise a glass instead.
Using a long line graph obscures recent movements, so we’ll note that over the year total all-worker private workweeks are down from 34.5 to 34.3 hours, and within that goods production is down 0.4 tenths of an hour, construction down 0.3 over the year and down 0.2 over the month, manufacturing down 0.6 over the year and 0.3 over the month. Retail was steady over the month, at 30.7 hours, which is down 0.4 from last year, and education and health are flat for the year and month, but down 0.1 from earlier in 2019. Leisure & hospitality is down 0.3 over the year, and transportation and warehousing down a full hour to 38.1 hours. Manufacturing overtime for both durable and non-durable goods continues to fall.
If it is so hard to find workers, and firms are holding on to their current employees, many of whom want to work longer hours, why are workweeks falling?

