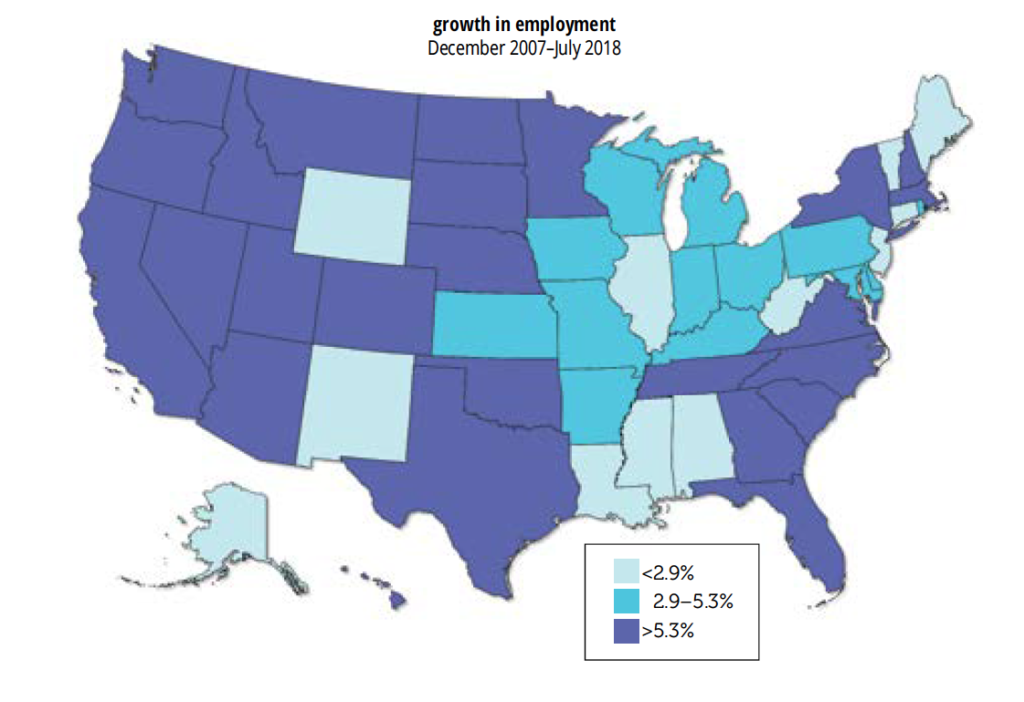
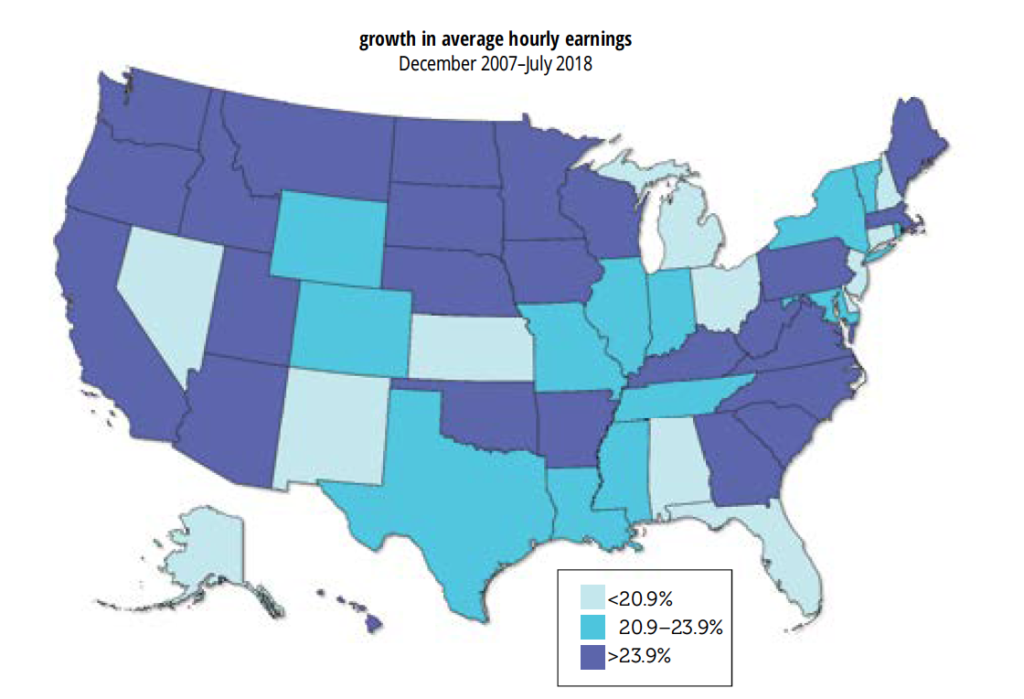
How have the states been doing on jobs and pay since the last business cycle peak? We’ve mapped some answers.
First E1, Employment: Between the last business cycle peak in December 2007 and July 2018, the most recent month available, the median state has seen a 5.3% increase in employment. At the top of the list is Utah, up 20.1%, with North Dakota and Texas close behind. Some of the bigger, richer states have done well, like California (up 10.8%) and New York (10.0%). So has Massachusetts, up 10.9%, a state that’s not thought of as a boomy place. At the bottom: Wyoming (-2.6%), West Virginia, (-1.1%) New Mexico (-0.8%), and Connecticut (-0.5%), who’ve all lost jobs over the last decade-plus. Also weak: Mississippi (+0.3%), Alabama (also +0.3%), Maine (+1.3%), Louisiana (+2.7%), and New Jersey (+2.8%). Of the ten states with the largest energy sectors, five (Louisiana, Alaska, New Mexico, West Virginia, and Wyoming) are clustered in the bottom quarter, and a sixth, Oklahoma, is at the median. Two are closer to the top, Texas and Colorado, but they’re generally more diversified economies than the ones at the bottom.
It’s interesting that while New York has done rather well, two of its neighboring states, Connecticut and New Jersey, haven’t. New York City accounted for 79% of the state’s employment gain over the period, nearly twice its share of the state job market. Were New York City a state, it would rank fifth in employment gains; New York State excluding the city would rank in the bottom third. This is a reversal of the trend of earlier decades when the urban core lagged its suburbs. For example, between 1990 and 2000, New York City’s employment gains were less than half that of the state outside the city.
Second E2, Earnings: There’s a huge variation in growth in average hourly earnings (AHE). At the top of the list, North Dakota, up 42.9% between December 2007 and July 2018. Since it ranked second in employment growth, its workers have done very well, a reflection of the fracking boom. South Dakota is in second place, up 38.9%; Oklahoma, third (34.7%); and Iowa, fourth (32.9%).
Four of the top ten states—South Dakota, Oklahoma, Montana, and West Virginia—are among the ten most energy-intensive. But other energy states did less well, with Texas (22.6%) just below the median of 23.9%, and Colorado (22.5%), Wyoming (21.7%), and Louisiana (also 21.7%) not far behind. California (25.0%) and New York (22.5%) are around the median. (There’s not much difference between New York City and State on earnings; the city’s AHE were up 24.7%.) Florida, Michigan, New Jersey, and Connecticut are all towards the bottom.
Texas is an interesting case. While it’s often touted as a jobs mecca, it’s not notable for high pay. That’s not to say that keeping pay down is necessarily good for employment. The correlation coefficient between employment and earnings growth between 2007 and 2018 is 0.37—not super-high, but still solidly positive. Job and wage growth often go together.


