The tundra swans that breed in the western arctic migrate thousands of miles to our west coast, gracing the skies and waters of California and scattered inland regions of Montana, Idaho and Utah. Close to two hundred of them were counted gliding on the Bear River wetlands near the Great Salt Lake last week. Other times, counts are in the thousands. The populations that breed in the eastern arctic travel to the Great Lakes and, mostly, the midAtlantic coast, some stopping over at the Harriet Tubman Underground Railroad National Park in Maryland these days, and are iconic on the Chesapeake Bay.
Our other native swan, the larger trumpeter, far more local, was brought back from the brink of extinction beginning in the early 1900s, when, after three centuries of overhunting, only a few dozen remained. Damage to muskrat and beaver populations also affected swan populations who nest on their dams and dens, and as these industrious rodents recovered, swan habitats improved as well.
There is another swan in the United States, the mute swan, introduced in the late 1800s largely as an ornament on wealthy estates. With few natural predators, and impressive survival agility, mute swan populations have grown, and in some coastal regions nesting species may have reached carrying capacity. Hudsonia, the small ecological research institute I work with, recently put together a round-up of current knowledge to help inform the ongoing debate on how to handle this charismatic, but potentially problematic, species, excerpted here.
As is often the case with introduced species, impacts of mute swans may be assumed rather than documented, raising the possibility that these birds are the subject of an ecological narrative, to borrow Robert Shiller’s well detailed economic narratives, those partial truths we repeat sometimes without much of a fact check. Sometimes those narratives are amusing, sometimes annoying, but in fact they drive policy decisions often with poor outcomes. Managing swan populations either by addling eggs or culling the birds themselves is an expensive long-term commitment, with no guarantee of success. Our conservation resources are limited.
Mute swans are accused of harassing other nesting waterbirds, depleting aquatic vegetation, attacking humans, and polluting bodies of water. Sometimes they are guilty as charged. And they aggressively defend their nests, as do our native swans who fend off many predators, including foxes. In the popular press, a mute swan defending his nest may come across as aggressive, a tundra swan, valiant.
And, like most birds, they eat a lot. Some ecologists and hunters are concerned that their habit of uprooting more than they eat could deplete submergent aquatic vegetation (SAV), the nursery grounds of fish and crustaceans, thereby reducing duck populations. And on their loafing sites, funny concept, apparently they have inadvertently trampled the nests of rare shorebirds. However, to Hudsonia’s knowledge there have been no species-specific studies of other birds’ nesting success in the presence of mute swans, and most aggression is directed toward also burgeoning year-round populations of Canada geese. Other than isolated accounts, there is “no evidence to support nesting disruption of marsh-nesting birds.”
The primary factor in the widespread declines in SAV beds, documented in coastal, estuarine and lacustrine habitats around the world, is reduced water clarity caused by inorganic sediment, nutrient additions, and eutrophication. For example, sediment that comes into the Hudson River during heavy rains persists for years and even decades, resuspended by recurrent rain storms. Exposed agricultural soils, point sources like treatment plants, and impermeable urban and residential surfaces all contribute, their effects tending to be exacerbated by the warming effects of climate change. There is evidence that animal herbivory is more damaging in areas already over-stressed by those effects.
We already have developed methods to improve water quality ready at hand, identified by the science as the driving factor in restoring and preserving SAV beds, and such projects create entry-level jobs in science and conservation work, sectors that look weak in Bureau of Labor Statistics’ projections. Managing runoff would potentially be of greater value than managing mute swans on many levels.
Focusing on one introduced species, here mute swans, also detracts attention from coming up with integrated solutions that treat the many stressors, including alien species, as part of a web to be rewoven as best we can.
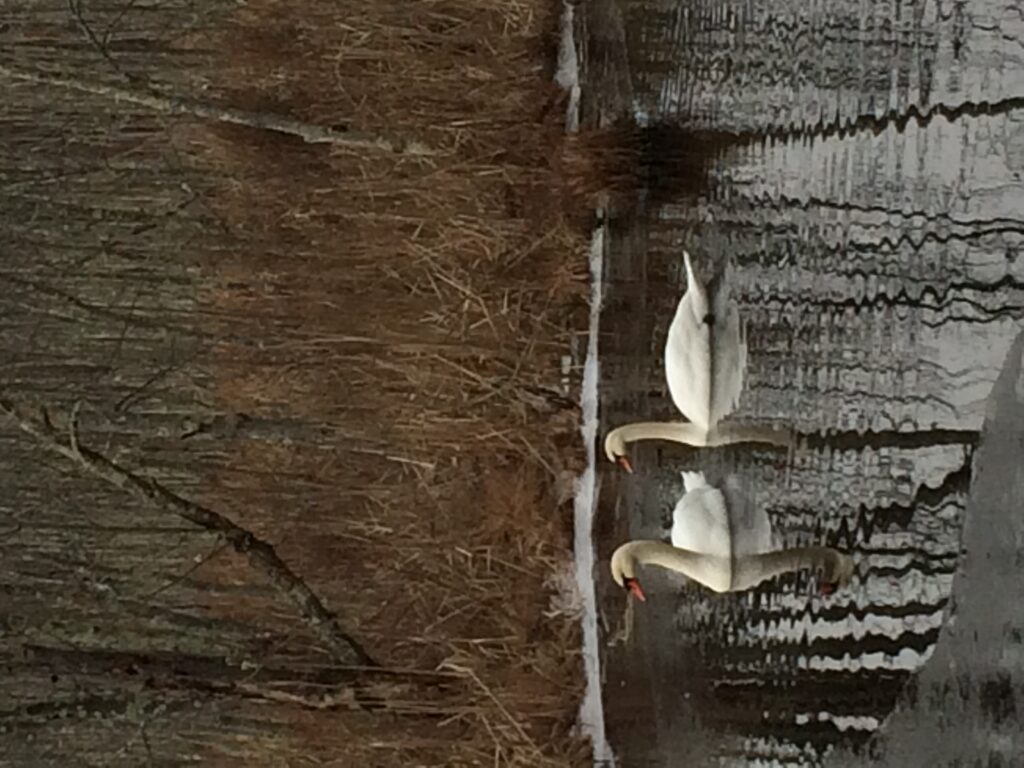
Photograph of mute swans in New York, P. Dunne




We’re Not All Theme Parks
Regional Economic Models Inc. recently hosted two webinars showcasing uses of their models in valuating two specific resources in Florida. In The Bridge to Space the SR 405 bridge that links the Kennedy Center and Patrick Air Force base to the mainland was under the ‘scope, and another focused on the Wekiva River, one of Central Florida’s few near-pristine river systems, a National Wild and Scenic River comprising over 110 square miles, including 42 miles of flowing water, and 34 named springs.
Years ago damage to the SR405 bridge, from age, hurricanes and water rise, made it increasingly hazardous for “heavy aero-space payloads,” and Luis Nieves-Ruiz, of the East Central Florida Regional Planning Council, was called in to assist local planners on the pros and cons of replacement using models, some that his team developed. Replacement turned out to be a true no-brainer: annual spending by tourists alone was found to be twice the replacement cost, even without the big assist from U.S. DOT. Permitting is now underway, securing over $300 million in annual tourist spending, and billions in corporate sales and GDP, not to mention big science.
Although the price tags on the Wekiva River are much lower, it is also crucial to its region. Nieves-Ruiz’s estimates run to 429 jobs, $51 million in output sales, $19 million in personal income, and a $30 million add to GDP. And property values. (As that old California joke goes, prices on the Pacific Coast Highway are much higher for even-numbered addresses.) A degraded river system puts minus signs before those numbers.
Photograph from Florida State Parks
According to Nieves-Ruiz, Florida’s springs are developing some issues with algae, brought on in part by water being transferred to development and away from stream flow, a particularly dangerous situation since Florida’s water supply is almost entirely reliant on aquifers. Nieves-Ruiz notes that remediation is more expensive than protection.
And we’ll add not always possible, and we’re still in the early stages of understanding our natural water systems. For example, it was only in 2013 that the aquifers under Australia, North America, China and South Africa’s continental shelves, holding something like half a million cubic kilometers of low-saline water, came to light. And we now understand that, remediation efforts notwithstanding, the deep organic soils in our water-systems take thousands of years to develop.
Local, targeted work, such as these studies, that reprices the unpriceable, our natural jewels as Nieves-Ruiz put it, shows us the many paths to a sustainable economy. Although he didn’t say it like so, Nieves-Ruiz corrected the local practice of applying the much higher daily spending of theme-park visitors, with their full-service hotels and high-ticket prices, to visitors to the Wekiva system, with their “primitive camping” and canoe rentals.
And that’s kind of the point. Keeping these lower priced activities whole is part of the critical local netwok that safeguards the entire state’s water supply.