We are happy that our interpretation of Fed Governor Lael Brainard’s speech on Tuesday, May 30th, to the New York Association of Business Economists seems to have had an effect on how analysts are viewing the current economy. As we wrote here, her talk was not the shedding of her dovish feathers, but a continuation of her focus on ongoing weakness in inflation despite, as she put it, the growing number of forecasters who believe the U.S. economy is at or very close to full employment. We decided to let the spiders do the talking on the state of US employment, and on inflationary pressure, or lack thereof, the now ubiquitous tag.
First employment. Here’s an updated employment spider inspired by one put together by James Bullard, the president of the St. Louis Fed, when he was feeling “Halloweenish” back in 2015.
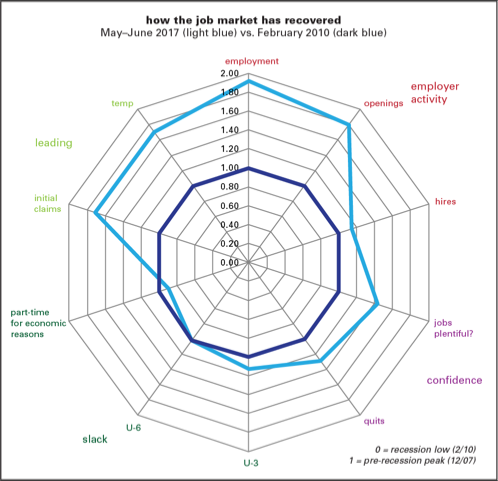
The graph uses an integer measure showing the percentage of recession losses that have been regained in recovery and expansion. (For example, an 0.5 reading means that 50% of the losses have been regained; 1.5, 150% have been regained. In most of what follows, the numbers are well above 1, meaning that they’ve recovered and then some.) In a phrase, we’re well beyond the recovery phase and firmly into expansion.
Bullard sorted ten major employment indicators into four groups: employer activity (payroll employment, job openings and hires from JOLTS), confidence (“jobs plentiful” from the Conference Board’s confidence survey, quits from JOLTS), slack (narrow and broad unemployment, share working part-time for economic reasons), and leading (initial claims and temp employment). The measures of slack are the least recovered, with the share working part-time for economic reasons the only one of the 10 still in a hole. Hires are lagging both openings and employment. The leading indicators are looking good, though with the growing casualization of employment, temporary firms may have lost some of their leading characteristics. And the confidence measures have also picked up nicely.
Which takes us to the next spider (or radar, if you prefer) graph. With the job market relatively strong, how would a such a graph look for inflation? Much, much weaker.
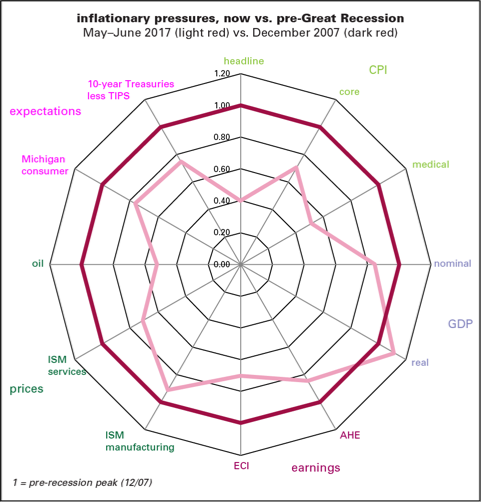
In this graph, we’re not looking at losses recovered but how the inflation-related indicators look compared to their levels at the onset of recession in December 2007. Following Bullard’s model, we sorted twelve inflation-related indicators into five groups: CPI measures, GDP measures, earnings, prices, and expectations. Headline year-to-year inflation is 60% below its pre-recession level; core, 30% below. Even medical inflation is down by half. That’s true even though real GDP growth in 2017Q2 was a little above where it was in 2007Q4. Underscoring the point about the lack of inflation, nominal GDP growth is well below end-2007 rates, unlike its real counterpart. That speaks to calls by Fed advisor Michael Woodford to track nominal GDP as a way of getting around problems with inflation adjustments Average hourly earnings growth is more than a sixth lower than it was ten years ago, and the employment cost index, over a third lower. Price indexes in the ISM surveys, especially services, are also below where they were at the end of 2007—and the oil price is down by half. And inflation expectations—measured by the Michigan survey of consumers, and what is implied by the spread between 10-year Treasuries and comparable TIPS—are about a quarter below where they were then.
With monetary policy gently lifting and fiscal policy in great disarray for now, deflation looks like more of a risk than inflation.
Spotlight on shelter inflation
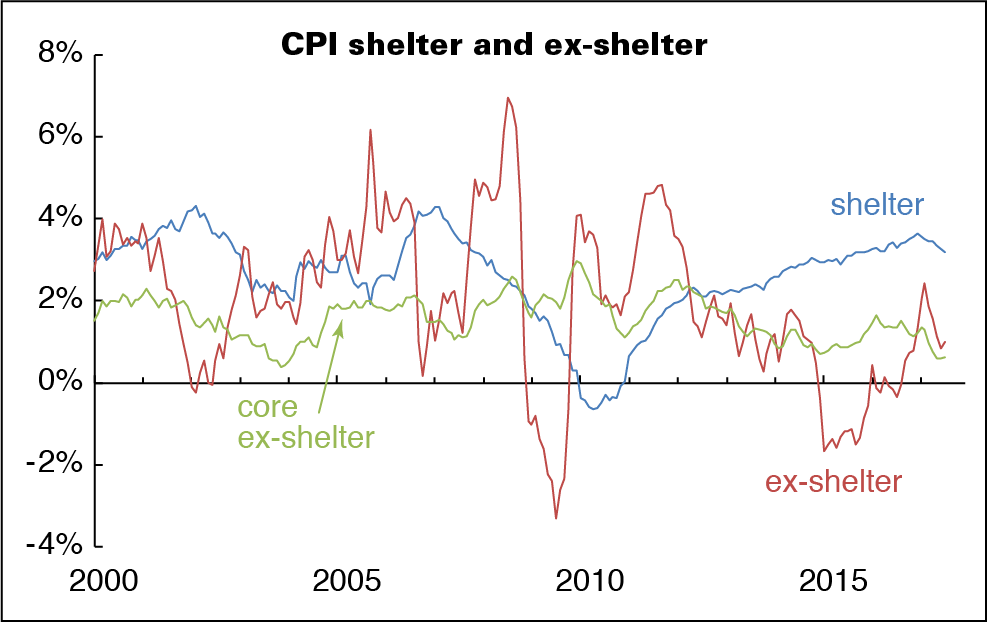
It’s been nearly a year since we looked at the outsized contribution of shelter to the overall inflation. It’s still outsized.
For the year ending in July 2017, both headline and core inflation were up 1.7%. That’s about where the headline number was a year ago; core was half a point higher. But inflation in shelter was 3.2%, down only 0.1 from a year ago. Take shelter out of core inflation, and prices are up 0.6% for the year, less than half the rate twelve months earlier.
Now we realize that taking food, shelter, and energy out of the CPI takes slightly more than half out of the market basket. Our dear John Liscio used to joke that some analysts wanted to take so many things out of the price indexes that poor Hampton Pearson of CNBC would have to report the numbers while standing in front of the BLS in the dark, wearing only a barrel. But inflation that’s largely concentrated in shelter and (from time to time) energy doesn’t have much to do with the shape of the labor market.
Tire kicking
Quite the buzz arose on the release of the June Job Opening and Labor Turnover Survey (JOLTS) numbers, showing record-tying openings in the private sector. (There wasn’t much else of note in the report; the hires rate was flat, and the layoff rate was up 0.1pp from May and the prior year.) The inability to find qualified employees is the standard explanation; a creative variation that’s arisen recently is that too many fail their drug tests, or would if they had the nerve to take them.
We’re flipping that argument. How can the high level of openings coexist with a less exuberant quit rate (which, by the way, slipped a notch in June)? In 2006, openings ran 0.9 points above quits, the spread tightened into 2009, and then widened again. It’s averaged 1.7 since 2015, and in June was 1.9. Why has the gap widened so?
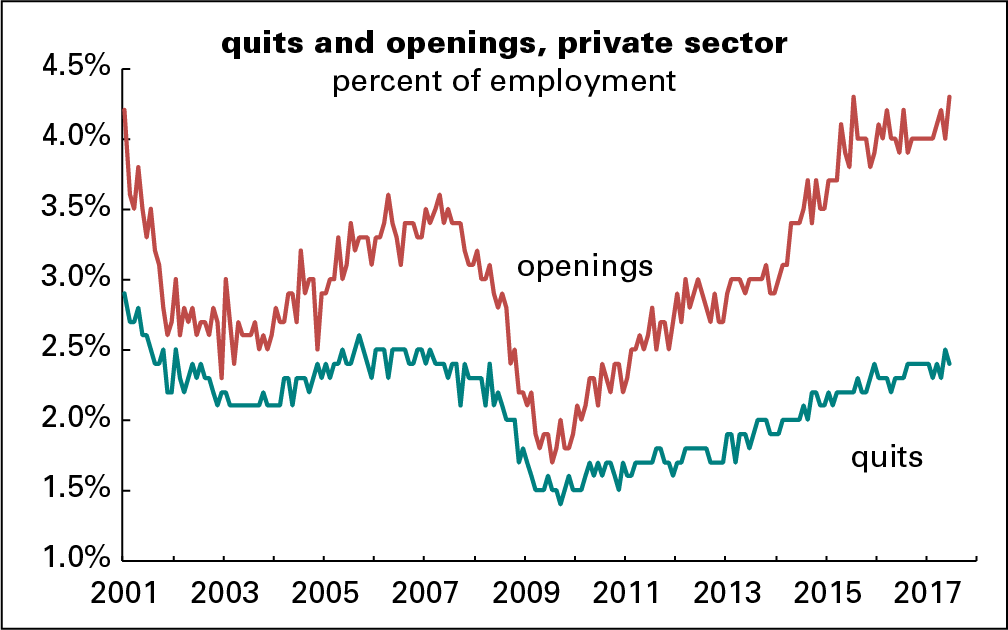
Presumably the already-employed are qualified and capable of passing a drug test. It seems odd that employers with all those openings don’t bid them away. Could it be that employers just don’t want to pay up, or can’t with productivity so weak?
Perhaps, also, the already employed are aware that their own employers are putting out feelers but reluctant to follow up with actual hires.
We’re not even talking about drawing the unemployed or marginally attached in from the sidelines. If there is real information in the openings rate, we are confident there would be more job-switching.
July sales tax collections
In July, 54% of the states in our survey met or exceeded their forecasted sales tax collections, down from June’s 70%, and 97% reported growth over the year. That’s better than June’s 82%, but was padded by the fact that July 2016 ended on a weekend, forcing payments into August last year. The average over-the-year rate of change moved to 4.7% from June’s 52%, and the margin from forecast rounded down to 1% having rounded up to 1% in June.
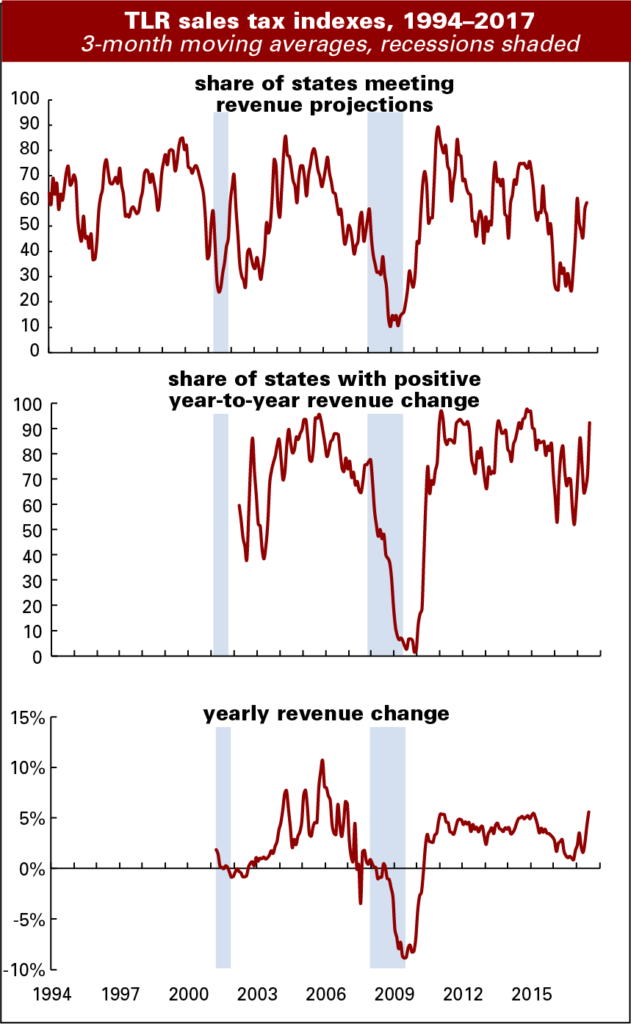
July collections tend to be a “throw away” month in revenue departments. Some of the collections accrue back to June, and July is what’s left, so trend watching resumes in earnest in August. The positive comments were subdued. Our contact in a large western state noted that they are continuing their “trend of beating forecast,” but that’s a conservative 1.2% for the current quarter.
The energy extraction states had another strong month, but recent state detail on job gains in those states does not suggest that extraction employment is leading the way. No surprise there, it’s a tiny sector. For example, in Texas, logging and mining work constitutes just under 2% of total employment, so its 7% contribution to the over-the-year gain of 313,000 jobs is impressive. But that contribution is eclipsed by professional & business services, and government work’s contributions of 20%, or 60,000 jobs each. Each of those sectors comprise about 14% of total employment.
In some states collections soared toward the end of the month and faded in the early days of August, reflecting the calendar effect. Our contact in one such state noted that his conversations with industry leaders does not suggest a consistent “more jobs=more spending” scenario, but rather that perhaps the better job gains among college students this summer is contributing to decent withholding and quite strong sales revenues. He’s also concerned that debt may be creeping up.
State-level GDP: Down on the farm with energy rising
During first quarter of 2017, economic growth declined in five of the seven Plains states. Within this region, only Missouri and North Dakota saw their economies grow during the quarter. North Dakota’s growth came from a reviving energy sector that contributed 1.7pp and offset almost the entire 1.9pp drop in its agriculture sector. Missouri’s agriculture sector declined by 0.8pp, but this was offset by relatively strong growth in durable goods manufacturing and wholesale trade.
The states that experienced the greatest declines in output were Nebraska (-4.0%), South Dakota (-3.8%), and Iowa (-3.2%). Lower prices for row crops likely explain the decline. During the first quarter of 2017 corn prices averaged 4.4% below the prior year and wheat prices were down 11.7%. Soybean prices were up somewhat compared to 2016 but were trending lower.
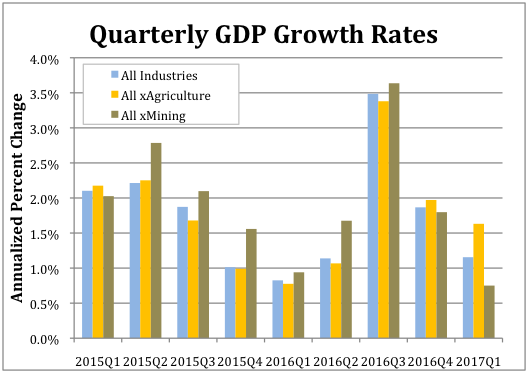
Nationwide the agriculture, forestry, fishing and hunting sector subtracted 0.41pp from the overall annualized growth, which totaled 1.1%. As the accompanying chart shows, absent the agriculture sector national GDP grew by 1.6% during the first quarter.
The fasted growing sector in Q1 was mining, which includes oil extraction. It was up 0.3%. As shown in the accompanying chart, excluding the mining sector national GDP would have only increased by 0.8%.
Texas 3.9% gain was the strongest. Its mining sector increased by 2.1pp. West Virginia experienced the second highest rate of overall growth at 3.0% and its mining sector contributed 3.2pp. New Mexico had the third highest growth rate at 2.8% with its mining sector contributing 1.8pp. Other energy states also experienced increased growth. Oklahoma’s 1.9% growth in output ranked 11th and noisy Alaska’s 1.8% growth ranked 14th. (A revenue estimator from the state told us they basically don’t even try to forecast revenue growth in the state because the economy is so volatile.)
But other energy states did not fare as well. Lousiana’s economy grew by only 1.0% (ranked 28th). Growth in Wyoming clocked at just 0.9% (32nd), and Montana saw a 0.5% decline (45th)
Finally, a couple of standout states for the quarter were Washington and Wisconsin. Washington continued a pattern of strong performance from 2016 when it took the blue ribbon. Its economy grew at an annualized rate of 2.7% during the first quarter and by 3.8% for all of 2016. This growth was driven by its information sector, which accounted for 1.7pp, and durable goods manufacturing, which accounted for 0.7pp, of the overall growth. Wisconsin’s 2.1% annualized growth for the first quarter represents a reversal of fortune from 2016 during, when its economy grew by only 0.9%. The sectors that contributed the most to its first quarter 2017 growth were real estate (0.6pp), durable goods manufacturing (0.4pp) and nondurable goods manufacturing (0.4pp).


Charlottesville
This commentary was co-authored by Philippa Dunne (The Liscio Report) and David Kotok (Cumberland Advisors). It reflects their personal views. Philippa notes it was a real honor to write this with David. And that it was so very “David” of him to remind her that James Alex Fields, Jr., is innocent until proved guilty.
A saga unfolds. First, snippets of online news, followed by TV images and “breaking news” reports. “Another one,” she thinks. “Ugh!” he exclaims, “madness! Why? What is the matter with these people?”
Two thousand miles apart, each in their own home, these two friends experience a similar aching angst over the futility of their efforts to try to improve a world that now seems to be rejecting their vision. After all, hate and anger triumphed in Charlottesville. Death arrived on scene, and innocents and innocence were among the casualties. Hate always seems to end that way.
Is hate learned, or is it embedded in some strand of DNA passed down through every human generation? Nazis hated, and Jews died. Then millions more died worldwide. Generations were seared and scarred. For what? To what end?
Geneticists who have decoded the human genome tell us that there is really only one human race, not multiple races within the species, yet the notion of a color scheme still grips some human imaginations, with disastrous results. White hated, and black and red died. And within this awful spectrum, each race’s history is replete with its own internecine murder and torture. Yellow on yellow, brown on brown. White on white. Red on red. That’s our history.
Bling! That little noise is now nearly continuous, announcing incoming mail in the wake of tragedy. A quick look. She has written:
“I am guessing you are sharing my grief today. I know grief isn’t much better than hope as a tactic – perhaps worse, but…”
Yes, he thinks. Grief, like regret, is an emotion that is not very effective, since it occurs after the damage is done.
He taps her cell number on his iPhone. They chat, just as if they are in the same room. How can his miracle of communications and the hate that ripped through Charlottesville occupy the same space and time? How can humanity have come so far and yet never seem to progress?
How can the many heroes who put their own lives on the line to shelter Jews and fleeing slaves people the same world as an individual who decides to plow his car into a group of people he has never met, or one who feels OK about walking down our streets wearing a T-shirt quoting Hitler. Quoting Hitler, you understand.
Pained, each recalls the writings of Joseph Conrad, and they share that sad understanding. Each feels the heaviness of this latest door opened into a “heart of darkness”.
Those of good will must not succumb, she and he agree, as futile as their efforts may seem at times. That is their closing pledge.
Conversations like ours must have taken place among friends all over the country, as we as a nation reckon with the events that unfolded in Charlottesville, Virginia, last week.
How do we brighten that dark heart? Platitudes abound, but first, we should take an honest look at our own motives. Listen to the stories we tell about why the economy is the way it is, why there is a growing number of disenfranchised citizens in our country.
If our theories are overly complicated, they are likely constructed to obscure basic truths. Think, by way of an analogy, of the tortuous paths the planets were said to follow in order to keep the Earth at the center of the old Ptolemaic view, obscuring for centuries the simple beauty of the heliocentric system.
Reality insists that we seek answers to life’s puzzles – and answer to ourselves. We’re forced to admit that we’re probably not up to sitting down and having a chat with someone who believes certain groups of people are subhuman. How do you shake hands with someone who was happy to call Sasha Obama a monkey on her sixteenth birthday? You don’t.
But we can do something about the decades of reckless neglect that are an integral part of our heritage. Targeting each other is clearly not working; targeting the neglect that drives the anger is, perhaps, the only way through.
Jobs are just one telling example: Yes, jobs are being generated by the sharing economy, but many of them are makeshift and do not make up for jobs lost to globalization and displacement of industry. The state of our workers is not an artifact of poor measurement. If that’s your argument, you aren’t looking at the facts on the ground.
There are many simple things to do. Someone recently suggested that PTAs in rich districts might take some of the money they raise to struggling sister schools. We’d add: Don’t mail it to them. Walk it over and tell the kids you are funding a specific project.
The US economic pie isn’t growing as it once did. Maybe we can do something about that through broader capital investment, especially in research & development.
Maybe we can’t… or maybe we won’t. We have to think about what it means that our workers are worse off today than they were in the 1950s. We need to recognize how easy it is for some to manipulate the anger that hardship generates. Set up a straw man, and by and by, someone succumbs to the urge to drive his car into a group of people he has never met. Wherever did those guys marching by eerie torchlight last Friday get the idea that Jews are out to “replace” them? Many of them are feeling shunted aside, that’s for sure.
We get to decide if the threat of manipulated anger is something we want our children to live with. Yes, that’s right. We get to decide. Note indecision or do nothing is also a decision.
As it is, everyone loses. Though James Alex Fields, Jr., is innocent until proven guilty, if he took Heather Heyer’s life as alleged, it’s hard to believe he didn’t also ruin his own.
(Photograph: The thousand-foot garden at Monticello)