CBO: US economy, less potential than ever
For better or worse, Congressional Budget Office (CBO) is the the go-to authority on budget projections. They are planning to update to their economic and budget projections in a couple of weeks, and we thought it would be interesting to look back on some of the CBO’s past projections. The results of that exercise make us want to say “for better or worse indeed.” And one more endorsement of the CBO official who expressed his opinion in 2007 that forecasting out more than a year or two is a waste of taxpayers’ money.
Just as we write when we’ve review the Fed’s economic projections, we don’t want to make fun of them: economic forecasting is a treacherous business. No doubt prudence demands that what is sometimes called “the forecasting community” give it the old college try, but one should regard the results with considerable skepticism.
The graph below shows several vintages of CBO ten-year projections for the major federal budget components compared with the actual history. We chose January 2007, because it was about a year ahead of the business cycle peak; January 2010, because that’s when we were crawling out of the Great Recession; and March 2016, because that’s the most recent exercise. The CBO was wildly optimistic about revenues in 2007, and surprisingly so again in 2010. It’s now projecting revenues will be essentially flat as a share of GDP for the next ten years. Given the trajectory of the “actual” line, that flatness seems unlikely, though of course that was an unusually volatile period.
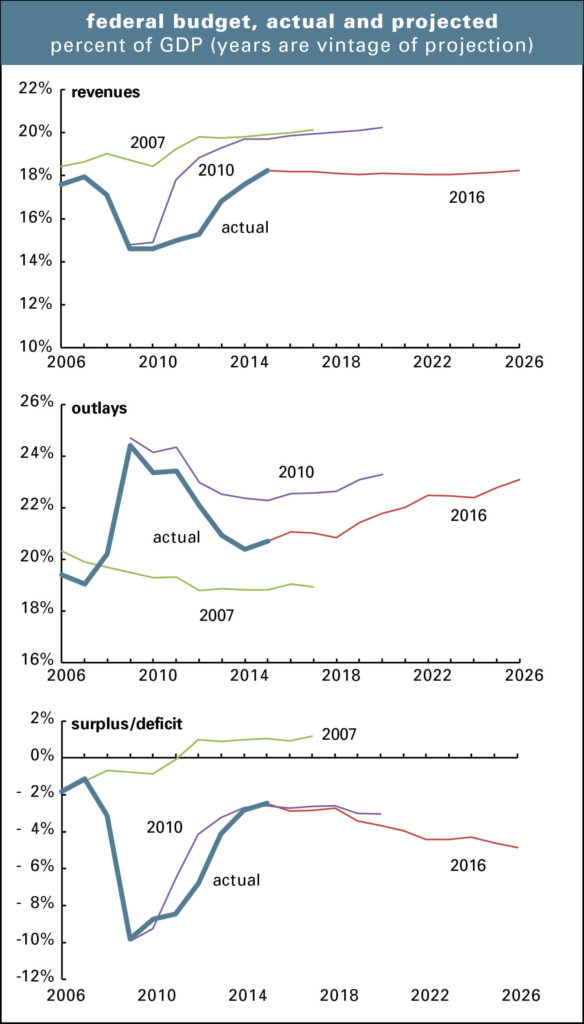
The outlay projections are also quite off-target—way too low in 2007, and way too high in 2010, almost as if the stimulus program would go on forever. The CBO is now forecasting a sustained rise of about 3 percentage points of GDP in outlays over the next decade—but the 2026 endpoint is below where it thought the 2020 level would be in 2010. And all are above the neighborhood it was thinking about in 2007.
As for the number the bond market is most interested in, the deficit, those projections aren’t so great either. For some reason, in 2007, the CBO thought the budget would soon be running in the black; it projected a surplus of 1.0% of GDP in 2012 compared with an actual deficit of 6.8%. It got the direction of change basically right in 2010 (despite having gotten the revenue and outlay projections rather badly wrong), though it got a little ahead of what reality would turn out to be. It’s now forecasting a gradual increase in the deficit over the next ten years. That is the standard wisdom, but given this track record, should we believe it?
And now on to a more arcane topic, potential GDP, which is of interest mainly to economists and central bankers. In theory, when actual GDP exceeds potential, inflationary pressures mount; when it’s below potential, there’s room for accelerating growth.
But as the next graph shows, the estimates of potential are quite unstable. In 2002, the CBO was estimating a potential growth rate of just over 3%, after recovery from the 2001 recession. Despite that recovery, which exceeded 3% from 2003–2005, the CBO marked down its estimates of potential growth to the 2.7–2.8% range, even for some of the period before the estimate. Reality outdid these greatly diminished expectations by contracting sharply in 2008 and 2009. But now the CBO sees the U.S. economy has having less potential than ever; it sees the growth in potential as 1.6% now (not that reality is outdoing that by much) and rising to all of 2.0% over the next decade.
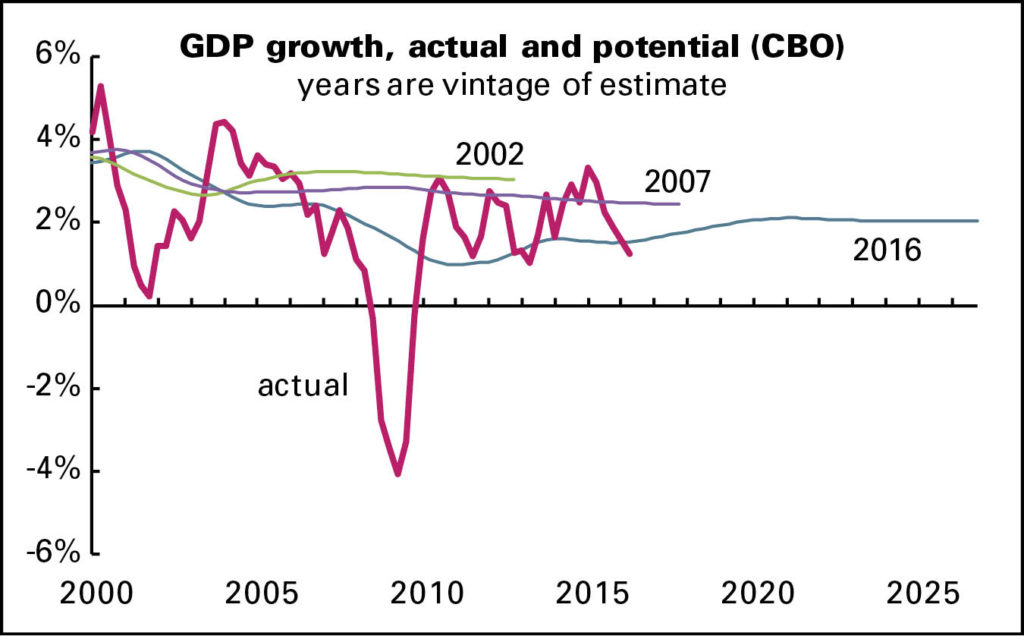
Should one actually make monetary or fiscal policy based on such projections? The glum 2016 projection is a function of slow labor force growth and weak productivity—but should we accept those, especially productivity, as the best we can do? Or should we instead be trying to figure out how to raise them?


Coffee into the Waves
For us, a good remedy for the brutal political tenor in the country these days is to read long and hard. You always figure that someone like Stuart Hampshire, who during his high-school years in the 1930s watched the men unemployed by the closing of the Mersey shipyards stamping their cold feet in the streets of Liverpool, while the women sold wildflowers to passers-by. He saw kids without shoes while shoe factories were laying off workers because they couldn’t sell their shoes, and coffee jettisoned into the sea for price controls. He knew those shipbuilders could well remain unemployed unless or until the looming war ramped up demand for ships. When that war did so he went into intelligence work focusing on the espionage efforts of Himmler’s Central Command, and came to believe there is nothing we are not capable of doing, and that a “thin layer of procedural justice” is crucial in balancing competing moralities within a society. He calls such justice more important to morality than courage (we’ll add that’s “acting from the heart”) because, say, a bookish life might require little courage. “Not so for justice, always required.”
Hard to argue with him, and he does a far better job of incorporating Shakespeare throughout his books than we ever have.
But we bring Hampshire up because he makes the distinction between restrictive morality, what we must not do, and the immorality that results from a lack of imagination. It’s not being Pollyannaish to say that the posturing that has replaced insight and discussion as we confront the economic issues we face these days has led to a profound failure of imagination, to all of our peril. And all the while the combatants fiendishly defend their negatives, what they believe cannot work.
Oh, and, Hampshire calls, “Which side are you on?” a “fatally over-simple question.”