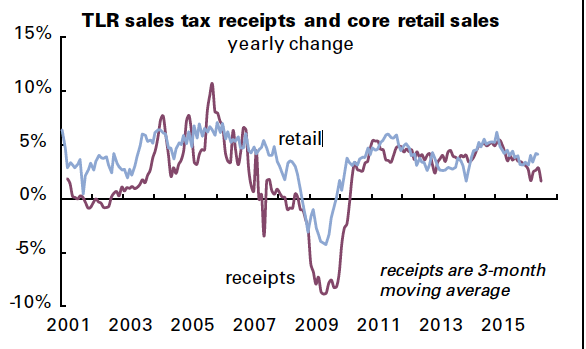
As we noted above, the yearly change in sales tax receipts in our survey is down to +1.1%, and the three-month moving average is running at +1.6%. Both are quite weak. The average since the series began in 2001 is +2.2%—and that includes the Great Recession. Take that out, and the average rises to 2.9%. Take out the months of the feeble recovery of late 2009 and early 2010, and it’s 3.3%.
The yearly change in revenue tracks well with the yearly change in core retail sales (that is, less autos, gas, and building materials). So far retail sales are holding up but will this continue? Maybe not: note how revenues appear to lag retail sales in the periods just before and after recessions. The pattern is especially striking in late 2006 and early 2007, as shown here:

And it may be happening again, as the two series parted ways in early 2016. It’s certainly far from conclusive, but it’s one of several possible recessionary signs that struck us as we prepared a recent issue.


