Articles by: admin

Stanley Fischer: “Reasonable People Can Disagree”

Stanley Fisher bravely gave a talk on labor productivity last week—bravely because Robert Solow was in the audience, which Fischer acknowledged as an honor, a joy, and something of a difficulty. In his talk Fischer touched on a number of possible measurement problems, but, like the majority of serious researchers on the topic we have quoted over the years, sees no reason to believe there has been an increase in any measurement bias, meaning the long standing decline in productivity is not a measurement problem.

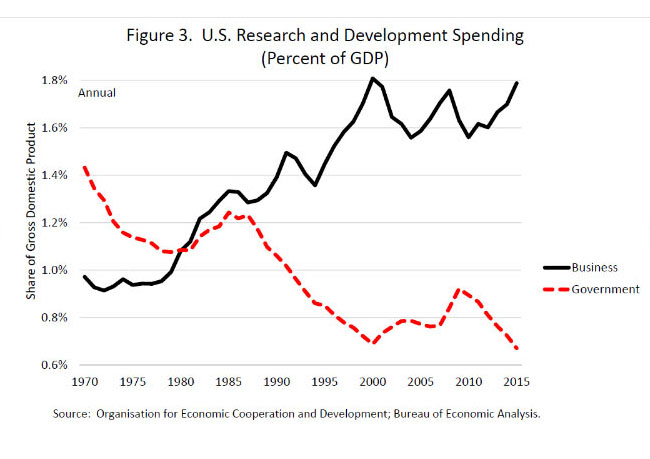
Fischer hauls out the old, and we’d say true, saw that public-sector research is responsible for the R part of the R&D pair, and the private sector is responsible for the D. This of course is a controversial statement, how many arguments have we all had on one side or the other? But the research in favor is pretty conclusive. The private sector has done wonders with the applications, but the basic materials are close to entirely produced in government or government-funded labs. (If you have evidence to the contrary, please send it along.)

That’s why Fischer calls the stunning trend shown below disturbing. We’d add it may go a long way toward debunking the idea that there’s any mystery cloaking current weakness in productivity.

pubpri

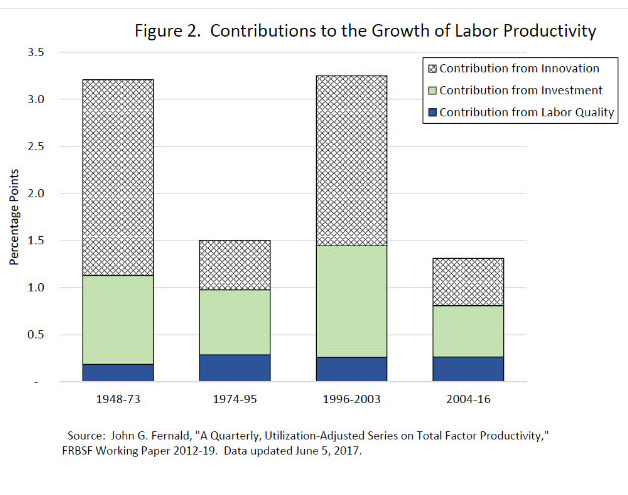
John Fernald, researcher at the San Francisco Fed who has had tremendous influence on the Federal Reserve’s overall thinking on the issue, has shown that labor’s contribution to productivity, driven by gains in educational attainment, etc., has been stable in the periods shown on the graph below, which were derived from his team’s work on the subject. Investment has been a dragging factor, but the real culprit appears to be innovation, the residual tracked by Total Factor Productivity. Somewhat elusive by nature, it’s designed to measure changes in output that cannot be explained by labor and capital. Belief in the power of that component of TFP was the Kool-aid of belief in the New Economy, but the contributions of formal and informal R&D, better management, gains driven by government-provided infrastructure (there would be no farming west of the Mississippi without federal water projects), and the creative destruction wreaked by highly productive firms on the trailers are certainly real.

inno

While we’re not graphing this, Fernald’s research shows that productivity contributions from IT producing industries peaked between 1995-2000, the contribution of IT-intensive firms increased ten-fold between 2000 and 2004, and then shrunk back to where it had been by 2007. Non IT-intensive firms plucked their low-hanging fruit by 2007, and their contribution disappeared by 2011. Many of the revolutionary increases in productivity took place in retail and wholesale trade, and in online brokerage back then. Nothing comparable is happening now.

Fischer believes that AI, his example is self-driving cars, medical technology (gene-driven treatments), and cheaper alternative fuels all suggest that we can reach for higher fruit, and raises the possibility that we may be in a productivity lull as these advances spread through the economy. He notes that it took decades for the steam-engine to make its changes. One hopes.

the Rule of 70

And Fischer cuts to the chase. In answering his rhetorical what does this matter?, he turns to his favored measure: how long it takes for productivity and, therefore, income, to double. During the 25 years between 1948 and 1973 when labor productivity was growing at 3.25%, it took labor productivity 25 years to double (70/3.25); in the 42 years between 1974 and 2016, with labor productivity growing an average 1.75%, it took 41 years to double. What is the difference between the prospects facing the young when per capita incomes are doubling every 22 years and when they are doubling every 41 years. An excellent reason to work to shift the tide.

Noting that reasonable people can disagree on how best to advance the objective, Fischer points out that another restraining factor may be uncertainty related to government policies, which stabilized in 2013, but was on the rise again in late 2016. Damping such uncertainty by more clarity is “highly desirable—particularly if the direction of policy itself is desirable.”

Perhaps we could harness some creative destruction and dismantle our $125 billion-dollar-a-year Grid Lock industry. (Forbes noted about 56% of that is direct, wasted time and fuel while sitting in traffic.) It’s a far cry from what we hoped for from the innovation residual, but perhaps we should try to recoup the kind of productivity gains that came with the interstate highway system in the 1950s and 1960s—only maybe with some 21st century modes of transportation instead?

by admin· · 0 comments · Fed Focus, Uncategorized

If the Fed Could Turn Back the Hands of Time

Perhaps that’s something The Maestro might have thought he could do, but the members of the Federal Reserve are showing considerably more humility these days. When you read their words, it seems they are by and large trying to do their work, and in a stretch when possibilities formerly known as curiosities, like the Zero Lower Bound, hopped out of theoretical research papers and onto their plates.

In a recent interview, David Beckworth asked St. Louis Federal Reserve Bank President James Bullard if, could they start all over again, members of the FOMC might consider nominal GDP or price level targeting instead of the current dual mandate of stable prices and hard-to-define full employment, Bullard’s careful response was, “I think…from just a theory basis, I think there is more sympathy than there would have been a few years ago,” and added we aren’t there yet. He himself is more sympathetic than he once was.

Inflation? Follow the Trend…

Bullard brought up the question–what drives inflation?—as a key issue today, noting that, “…the answer you get from various angles is always the same: that inflation doesn’t seem to be related to the variables that we think it should be related to.” Although he advances inflation expectations as one of the stronger contenders, even that isn’t particularly well correlated with inflation. (He also likes the idea that the central bank target moderates expectations, while the bank drives the ‘flation car.)

The Phillips Curve seems to have lost its swag, Bullard maintains it never had much, and the (unorthodox and troubled) fiscal theory of the price level—that prices are determined by government debt and fiscal policy, with monetary policy playing a muted second fiddle—“leads to a lot of confusion about what is being said.”

A funny thing about the Phillips Curve: it’s been roundly questioned since it was knee high to a grasshopper. Just six years after A.W. Phillips laid it out, Milton Friedman and fellow monetarists pointed out various issues. To Friedman, it had a basic defect, the inability to distinguish between nominal and real wages, and held only in the short-run and when inflation and expectations were steady. The economics of the coming decades further tarnished the curve’s reputation.

A bit simplistic but, of course, if the Phillips Curve were truly robust, there would be no such thing as stagflation; we’d be in a naturally correcting environment. Yet in the 1970s unemployment increased along with inflation, and in the 1990s unemployment and inflation fell together. The many other economic factors that affect pricing, including tight competition, supply shocks, a greater central bank presence, and changes in the make-up of the labor market, over-power the logical connection between low unemployment and inflation.

“Deflating inflation expectations,” a recent study by Stephen Cecchetti, Michael Feroli, Peter Hooper, Anil Kashyap and Kermit Schoenholtz, suggests we should pay less attention to expectations and slack and focus instead on trend. They argue that while inflation expectations do correlate with the trend, it’s a misleading relationship because as inflation moves, expectations move with it. They point out that if inflation is moving at 2%, most will expect it will continue to do so, and will be right. They suggest instead we compare the change in inflation expectations to the change in inflation. That doesn’t work so well: changes in inflation expectations “tell us nothing” about changes in inflation.

Since inflation is currently a bit below the Fed’s target, and long-term inflation closely follows the past few years’ average, they suggest the Fed will likely need to allow a short, modest overshoot to get us to 2%.

But Bullard also points out that in 2012, when headline and core inflation were right on target, he thought the Fed’s “work was done,” but then inflation began to slip, which he has noted was happening again in the spring. That overshoot may prove elusive.

…and get rid of Core PCE

Bullard suggests the core measure of PCE should be “thrown out.” First, he is not willing to go back to his constituents and say, “We stabilized prices, just not the ones you have to pay the most often.” Second, one of his colleagues looked into food prices and found that for some stretches they are the least volatile of all components. Bullard called it “kind of comical” that we’re throwing them out because they were so volatile in the 1970s. Third, core inflation “sunk a bit, maybe a couple of tenths on a y/y basis,” when energy prices fell in the 2014, and have since reversed course. That’s because there are core components that are heavily affected by movements in energy prices, so the effect is still in there.

Bullard favors the Dallas Fed’s trimmed mean measure, running at 1.5% in May, but since so many models were built on core prices, he doesn’t think there is much will to recalibrate them all. We’d say this is not a good reason not to work to improve such an important measure, but it may be an overwhelming one. Perhaps that argues for nominal GDP, which washes out any issues with how inflation is forecast and tracked.

by admin· · 0 comments · Fed Focus

Looking beyond Monetary Policy

Interpretations of Fed Governor Lael Brainard’s speech on Tuesday, May 30th, to the New York Association of Business Economists were wide ranging: some thought she has shed her dovish feathers, others that she is signaling uncertainty at the FOMC concerning the direction of monetary policy. We read her talk as a continuation of her focus on ongoing weakness in inflation despite, as she put it, the growing number of forecasters who believe the U.S. economy is at or very close to full employment. We’d like to look beyond the immediate implications for monetary policy in her talk and highlight some underlying premises. Part of that is admittedly because we think she is making important points but, hey, with rates heading up we will need to shift the conversation to the issues beyond the reach of interest rates. The sooner the better.

In her opening remarks she notes that we are currently seeing a synchronized expansion, which has moved global risks in a positive direction, and forecasts are moving up, which has broken a string of downward revisions. She is encouraged that the U.S. Labor Force Participation Rate has held steady even while facing, “what many believe to be a downward trend in demographics”; the employment/population ratio is at a post-recession high, and those working part-time against their wills is close to its pre-crisis level. The U-3 employment rate, the “official” rate, is now at its 2006/7 cyclical low, although she notes that the rate was at and below that level in the late 1990s.

If all continues to go as preliminary data for the second quarter suggest, the federal funds rate will be well on its way to neutral and the FOMC will turn its attention to the balance sheet soon. But.

Brainard quickly moves to the “tension” between the signs that we are reaching full employment, and the possibility that “tentative progress on inflation…may be slowing.” If progress on employment and the lack thereof on inflation persist, she will reassess the path currently outlined for both the funds rate and the balance sheet.

One concern is the unemployment rate, but not quite what you’d guess. What worries her is that in the past when the unemployment rate has been as low as it is currently, it has been hard for expansions to sustain themselves. With very little growth in the labor force, it’s hard to keep GDP moving. And, we’d add, even without law changes, a bellicose attitude toward immigrants could flatten what growth we are seeing, and even cause a contraction—or at least severe distress in industries like construction, restaurants, and even tech.

Brainard notes that in the past rising inflation has sounded the “death knell” for expansions, but that inflation expectations have been stable in the most recent expansions. From 1998 into 2001 core PCE inflation never exceeded 2% on a four-quarter basis, and the high of 2.4% in 2006/7 was a pass-through in import prices—in other words not a child of durable wage inflation.

She also notes the Atlanta Fed’s Wage Growth tracker showed upward movement in wages until about a year ago, but has shown little acceleration recently, the Employment Cost Index is up from a year ago, but down from two years ago, and boring old average hourly earnings are moving at the same pace they were last year. Core consumer price inflation (national accounts basis) was up just 1.5% on a twelve-month basis in the April report, well below the FOMC’s 2.0% objective, and although the most recent reports may have been depressed by upgrades to cell-phone plans, the distance to the goal is a “cause for concern.”

Take that, Phillips Curve

Calling the Phillips Curve a “less reliable guidepost” than it once was, Brainard turns to inflation expectations from the Michigan Consumer Confidence survey, which remain near their all-time low, although the New York Fed’s measure of three-year inflation expectations rose to its highest level in more than a year. Market-based measures of inflation compensation have improved, but remain below the average that ran between 2010 and 2014. She sees more signs of a slowing in inflation than an upside break, which she thinks may be the result of the non-linearity of inflation and unemployment when unemployment is so low. The flatness in the Phillips Curve is also apparent in European economies.

Brainard wonders if NAIRU is currently lower than it was, which makes sense to us, or if perhaps the U-3 is overstating the strength of the labor market. The employment/population ratio for prime age workers remains 1 point below its pre-recession level. She didn’t mention the quit rate, which is improving slowly but remains soft in many sectors by long-term standards, which we detailed recently and would argue has a lot to do with weakness in wage growth.

We put together an estimate of the quit rate between 1967 and 2000 using job leavers and short-term unemployment (the quit rate tracks those unemployed for less than 5 weeks very closely), and then switch to the Job Openings and Labor Turnover Survey’s measure, which began in 2000. Using the longer run quit rate, the current rate would be historically consistent with an unemployment rate of 6.3%; using the JOLTS period only, 5.1% Back in 2014 the quit rate was implying an unemployment rate of 7.7% instead of the 6.7% it actually was, so it’s a long standing disparity.

The wage piece of the U.S. labor market is having a tough time getting off the mat; if you put theory and ideology aside and listen to what people are saying, worker insecurity is a big deal these days, and compensation packages are far from what they once were. The Beige Book reported that employers are lifting wages to attract employees, but we don’t think that will overpower the long-term degeneration in wage structures that has occurred since the financial crisis.

Brainard didn’t change anything on her favored approach to reduction of the balance sheet, subordinated to changes in the funds rate—predictability rules at the Fed these days—and she reiterated that the balance sheet itself would come into play should the economy experience adverse surprises during the normalization process.

Revenues at the state level continue to do OK, if running below past performance. We believe that that relative weakness is itself another measure of the divergence between growth and prices evident in many data series, and Governor Brainard’s focus.

by admin· · 0 comments · Fed Focus

Productivity: The Gruesome Details

Productivity is one of our obsessions, and it should be a national obsession as well.* Clearly it isn’t. The industry statistics presented here show that for a lot of industries, the last couple of years have been a real bust.

The stats, provided by the Bureau of Labor Statistics, cover scores of industries, with the manufacturing sub-sectors particularly finely broken down. Here we’ve provided what is fashionably described in some circles as a “curated” list of industries, since the whole set is beyond our scope.

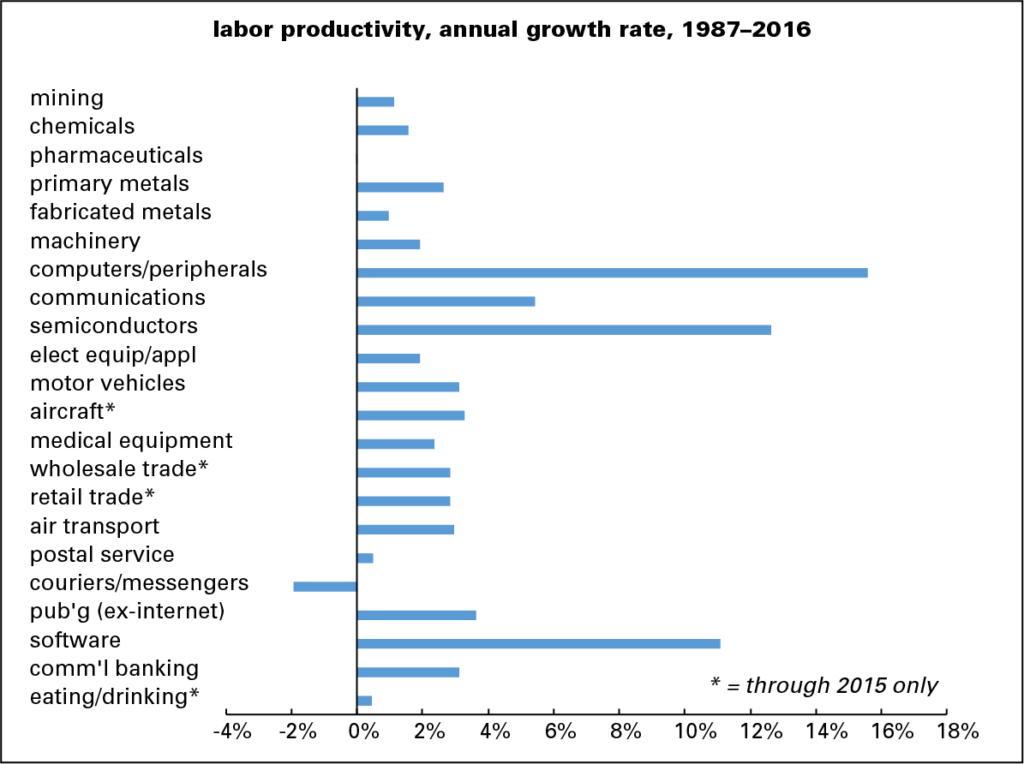
First the long sweep, from 1987 (when this series begins) through 2016, graphed below. (The 2016 data isn’t available for all industries; those for which 2015 is the terminal year are marked with an asterisk in all three graphs.) The standouts are, not surprisingly, in high-tech: computers, semiconductors, and software, all with annual gains in the double digits. Some old-line industries, like motor vehicles, aircraft, and wholesale and retail trade, turned in solid performances.

prod-by-indus-1987-2016

Eating and drinking establishments and, perhaps surprisingly, pharmaceuticals did quite poorly, with pharma slightly in the red—an amazing, if invisible on the graph, feat for such a technology-rich enterprise. And perhaps even more surprisingly, the postal service did better than private couriers and messengers, where productivity declined over the almost three-decade interval.

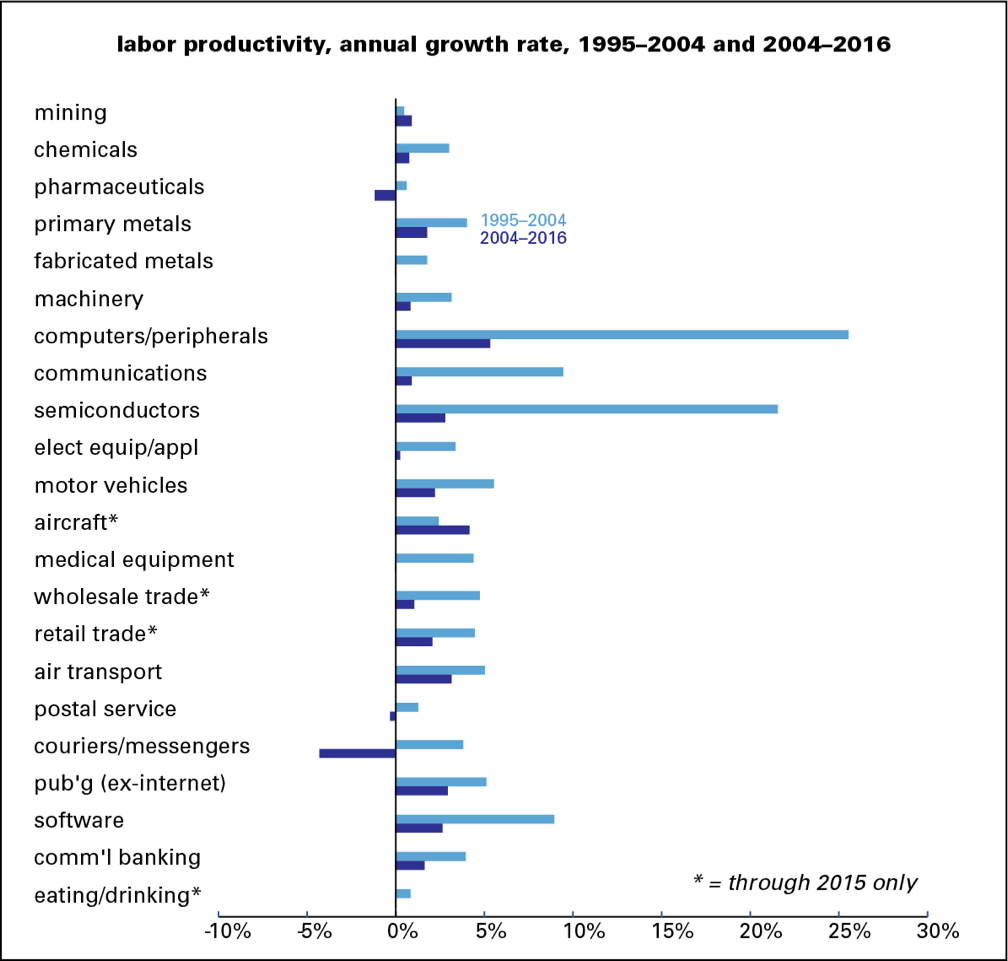
But as the graph below shows, most of the stellar performances were logged during the productivity acceleration of the late 1990s and early 2000s. Of the 22 industries shown, 20 saw a decline between that period and the last twelve years—a decline of over 4 percentage points on average. Only mining and aircraft showed a pickup. Computers and semiconductors fell by around 20 percentage points. Pharmaceuticals went from positive to negative.

prod-by-indus-boom-bust

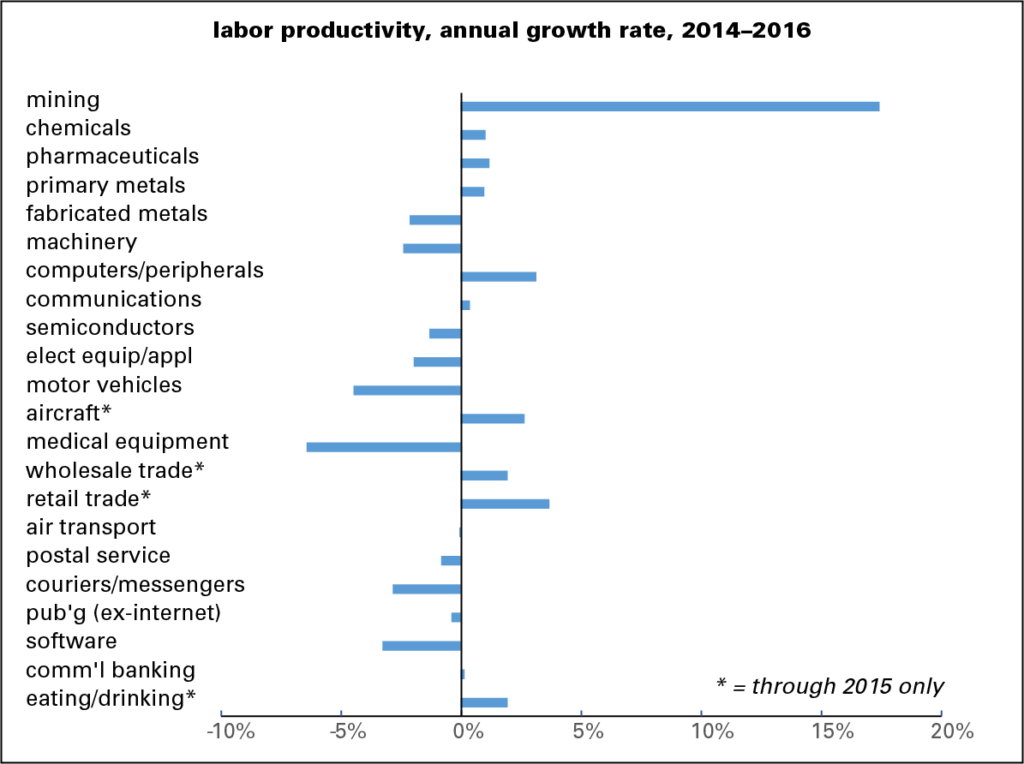
And the last couple of years have been fairly terrible. Half the industries showed a decline in productivity. Only mining—fracking, one assumes—had a strong performance. Computers remained in the black, but semiconductors fell below zero. Motor vehicles and medical equipment were firmly negative.

prod-by-indus-2014-2016

The productivity slowdown that we’ve been following at a high level is a pervasive problem at the industry level.

* For those of you not so obsessed, productivity determines our standard of living. An increase in productivity means greater output from the same input, which makes labor more valuable, which in turn lifts wages. Too many corporations are currently using their profits, and money borrowed on the cheap, to buy back their own stock and pay dividends to their investors instead of investing in productivity enhancing research & development, and physical capital. That’s one of the big factors in sluggish wage growth.

by admin· · 0 comments · Employment & Productivity

Risky Balance Sheets: IMF Confirms TLR Worries

For some time now, TLR has been pointing to risks in rising nonfinancial corporate debt levels – a sharp contrast with the deleveraging that has been going on in the household and financial sectors. In its latest Global Financial Stability Report, out this morning, the IMF confirms our worries, offering considerable detail on the nature and risks of increasing corporate leverage.

The IMF makes several points, among them:

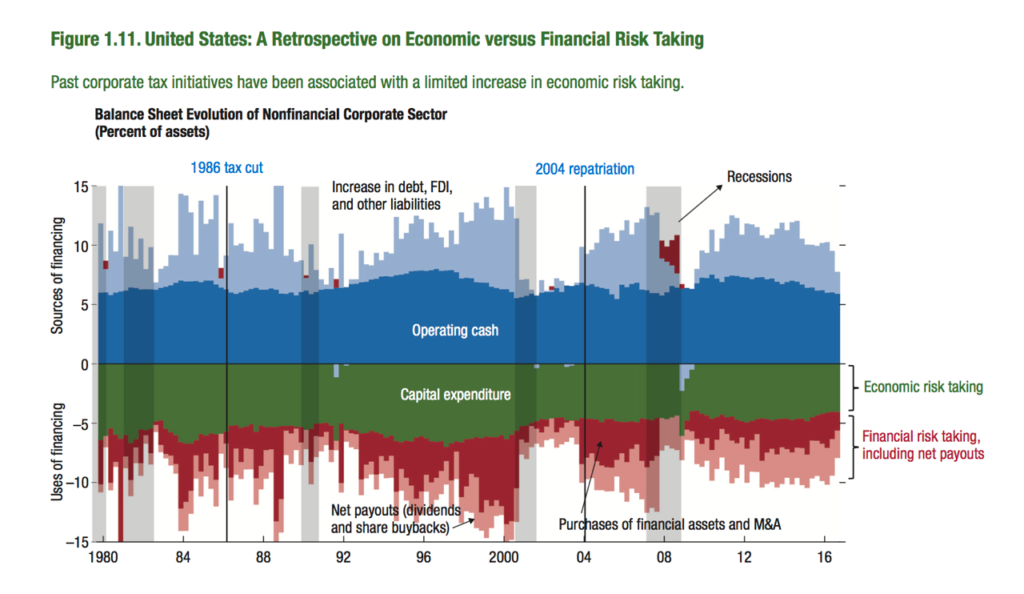
• Even with a cut in corporate tax rates, many firms would be too cash-constrained to increase capital spending – which is the economic rationale for such a policy change. Three sectors in particular – energy, utilities, and real estate – which together have contributed almost half the capital spending among S&P 500 firms in recent years, would find it difficult to boost investment. “Perhaps more important,” writes the IMF, “cash flow from tax reforms may accrue mainly to sectors that have engaged in substantial financial risk taking,” like purchases of financial assets, M&A, and dividends/buybacks. Such spending, the Fund notes, has accounted for more than half of free corporate cash flow since 2012 (another risky practice we’ve been highlighting in our quarterly reviews of the Fed’s financial accounts).

• Despite high equity valuations, firms have chosen to buy their own stock rather than floating fresh shares, and have often been using debt to finance the buybacks.

• Corporate credit quality, as measured by weakening covenants and rating downgrades, has been deteriorating – and not just in the energy sector. Capital goods and health care are looking dodgier as well.

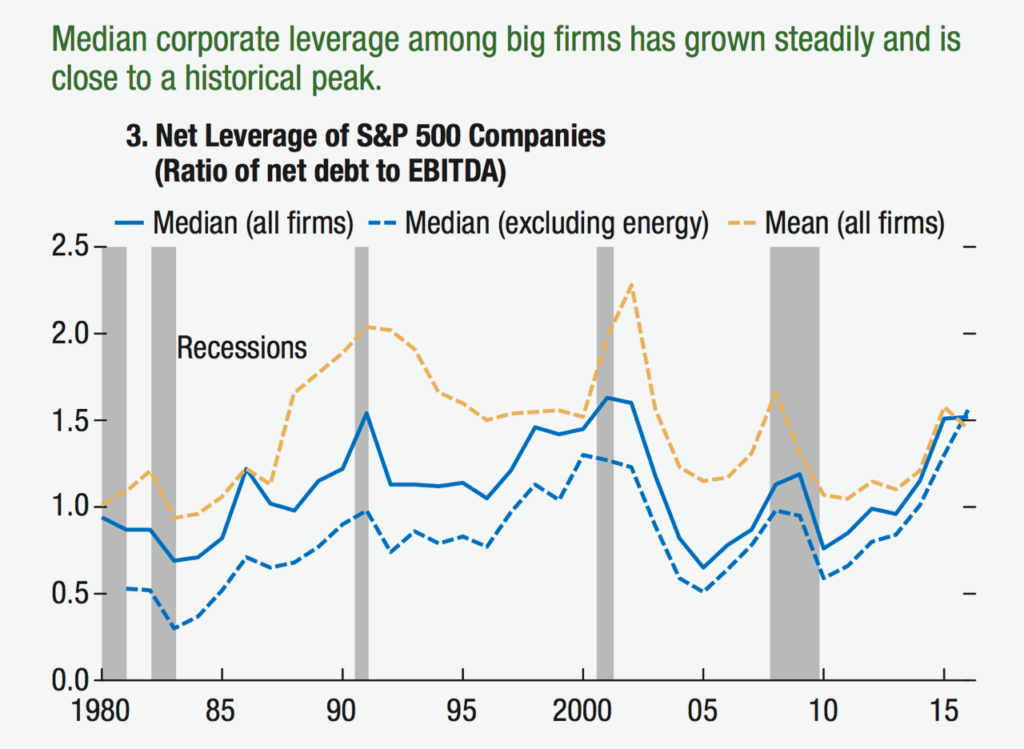
• Leverage ratios are rising as credit quality deteriorates. (See graph below. All graphs from the IMF report.) Median debt of S&P 500 companies is close to a historic high of over 1.5 times earnings – and it’s not just energy. A broader universe of 4,000 companies, accounting for about half of all U.S. corporate assets, is approaching levels last seen just before the global financial crisis.

screenshot-2017-04-19-1

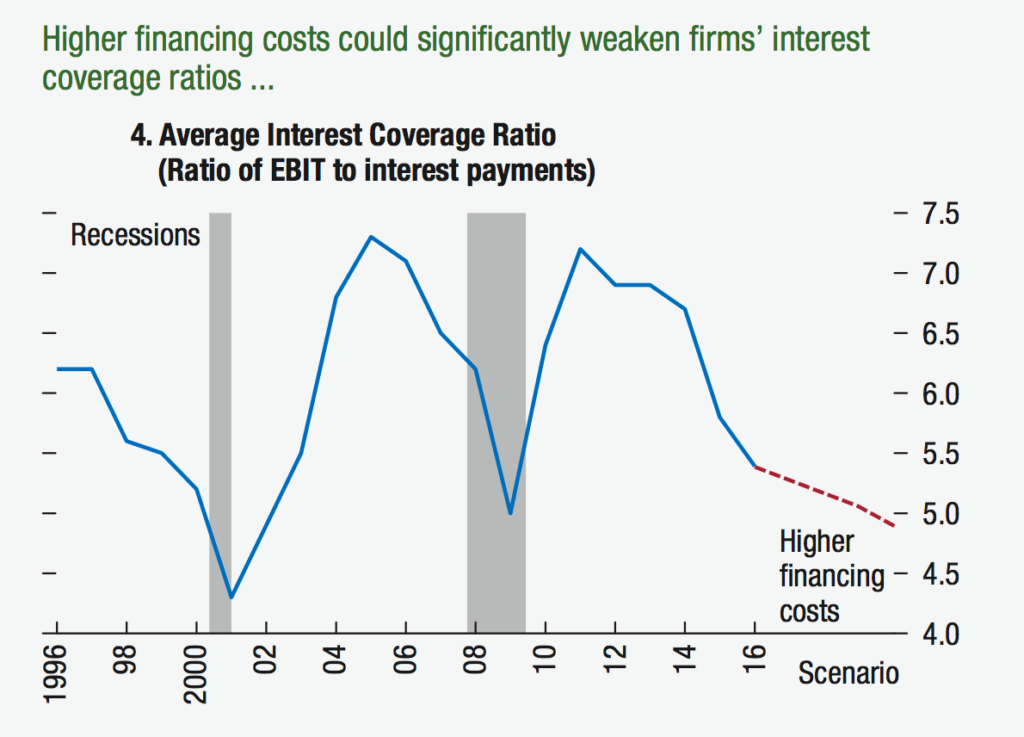
• Despite low interest rates, debt service ratios have fallen dramatically, as shown on graph below. Interest coverage is less than six times earnings, a ratio below what we saw before the financial crisis, and on a par with what we saw in 1999, just before the dot.com bust. Should tax cuts lead to wider budget deficits (which are not terribly high right now) and higher interest rates, interest coverage ratios could decline further.

screenshot-2017-04-19-2

• You might think that a cut in corporate taxes and moves that would allow the repatriation of funds stashed in tax havens abroad might ease the situation, but the IMF warns against those comforting thoughts. As shown on the final graph, the 1986 corporate tax cut and the 2004 repatriation led not to a reduction in debt or an increase in capital spending, but an increase in financial adventuring. Were such measures accompanied by a weakening of financial regulation and oversight, things could get very bumpy.

screenshot-2017-04-19-11-57-52

by admin· · 0 comments · Red Flags