TLR Wire

Startups Only Stable. We’re Waiting….

We keep looking for evidence that policy changes coming out of Washington—namely tax cuts and deregulation—are stimulating entrepreneurship and so far we’re coming up empty.

The latest evidence comes for the BLS’s Business Employment Dynamics (BED) series.

The BED series isn’t the timeliest around—we just got the data for the first quarter. But we shouldn’t get too hung up on novelty; these things have long-term effects.

Establishment births, expressed as a percentage of total establishments, were unchanged between 2017Q4 and 2018Q1, at 3.1%. (Establishment deaths, which are available with an additional three quarter lag—you want to make sure they’re really dead and not just unresponsive—rose between 2017Q1 and 2017Q2.) That 3.1% birth rate is below earlier peaks in 2005, 2012, and 2015 (each of which was lower than the previous).

Maybe things will pick up, but they haven’t yet.

by admin· · 0 comments · Comments & Context, TLR Wire

Tax Contacts: “Where are those wages?”

As those who follow our work know, we have frequent, detailed discussions with senior revenue officials around the county on a regular basis. Withheld receipts are better tied to ordinary wages than are overall Personal Income Taxes, which include estimated payments on stock income and the like, and are out in front these days. Recently, when discussing growth in withheld receipts with our revenue contacts, we’ve been hearing from some: “Where are those wages we keep hearing about?

Maybe here: profits are up far more than wages in this cycle—almost three times as much. And that’s a real issue in our debt-laden economy, especially at the low end.

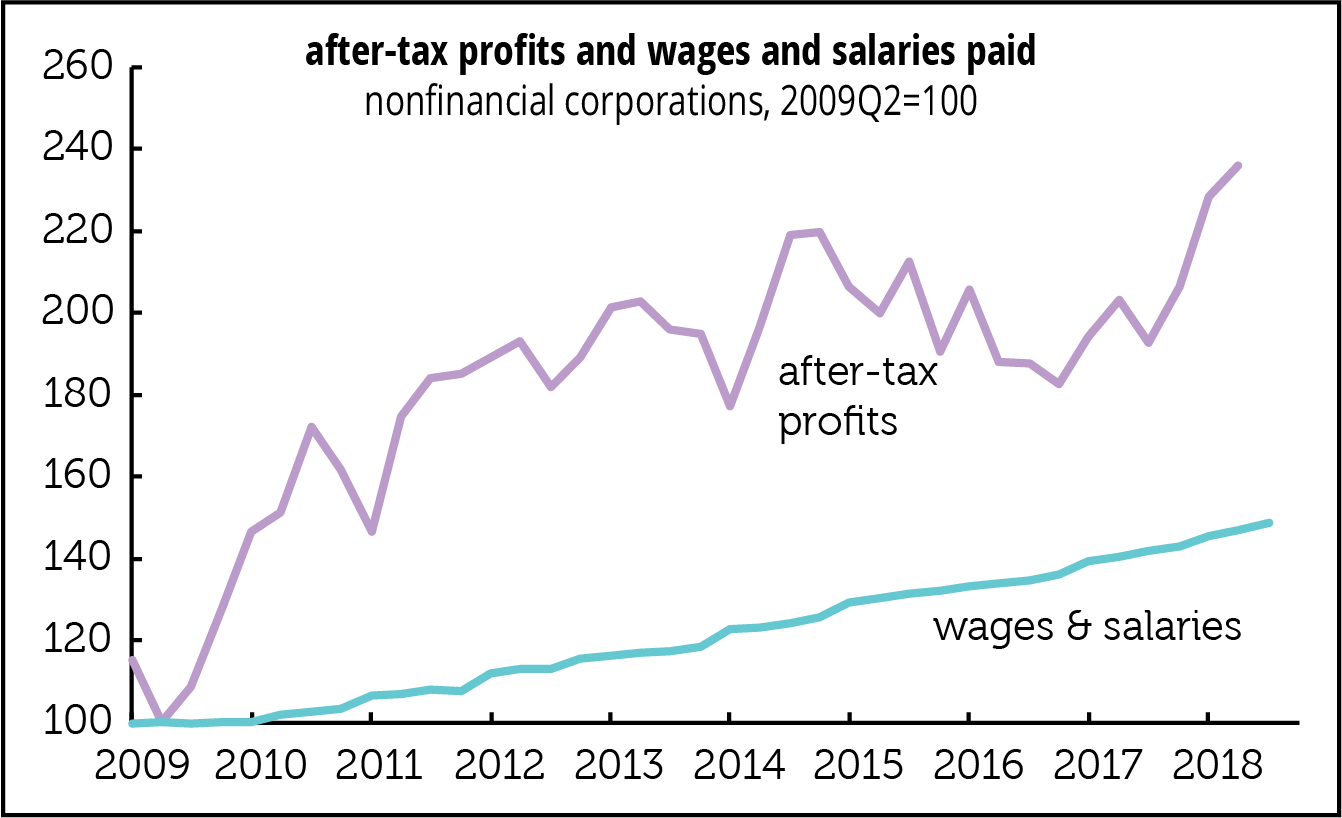
The two major factors of production, capital and labor, have enjoyed different rewards in this recovery/expansion. Graphed above are after-tax corporate profits and wage & salary payments by nonfinancial corporations, indexed so that the ending quarter of the recession, 2009Q2, is set to 100. (We use after-tax profits because those are what matter to shareholders, and because bookkeeping shenanigans at the end of 2017 and beginning of 2018 in anticipation of the tax cuts distort the numbers.)

Since mid-2009, nominal wages are up by 49%—but profits are up by 136%. (It’d be nice to present real measures but choosing the proper deflators would be a fatal challenge.) For a while, it looked as if profits had peaked in 2014, but they’ve made a healthy recovery since. And they got a splendid boost from the tax cuts.

by admin· · 0 comments · Employment & Productivity, TLR Wire

Earth to Kevin Hassett: If you use that wrench…

The other day, Kevin Hassett, chair of the Council of Economic Advisers, dismissed concerns about slow wage growth by saying that if you deflated average hourly earnings (AHE) by the index for personal consumption expenditures (PCE) rather than the consumer price index (CPI) earnings look a lot better over the last year. And, he added, it’s a mistake to look only at direct pay because a lot of raises are going into benefits. There are two problems with his argument: first, AHE have looked a lot better if you deflate them by PCE for most of the last three decades, and for second, benefits are running only slightly ahead of wages in the private sector, and rather behind overall.

Here’s a comparison of yearly changes in the two inflation measures. In 88% of the months since 1990, the CPI came in above the PCE.

And here’s what AHE look like when you deflate them by the two measures. Since the all-private series only begins in 1964, and the all-worker series in 2006, we’ve chained nominal wages from those two series together with manufacturing (which go back to 1939) to produce a long-term measure. Using the CPI, real wages are 4% below their 1973 peak; using the PCE, they’re 18% above. We’ll leave the topic of which is the better measure for some other time. But any recent outperformance of real wages using the PCE rather than the PCI is a very old story.

Finally, benefits aren’t doing that great. Here’s the history from the Employment Cost Index (ECI) series. Overall compensation growth in the second quarter was at the high for the cycle—but it’s below early troughs, like 1987, 1995, and 2006. Benefit growth is only slightly above wage growth, and is nothing compared to the bulges seen from 1988–1993 and 2000–2005. A major reason for this is the deceleration in health costs. Employers’ health costs were up just 1.5% for the year ending in 2018Q2, a third the 2010 average of 4.8%, and less than a fifth the 2000–2006 average of 8.2%. Health insurance costs are now lagging overall medical inflation; they exceeded it in the early periods by a wide margin. That suggests employers are shifting more costs to employees.

By the way, here’s what the ECI looks like compared to AHE. We don’t recommend making a habit of using the ECI as “truth.” When we asked an economist at the Bureau of Labor Statistics some years ago what he thought of substituting the ECI for AHE, he said, “If you use that wrench, you’re going to strip that bolt.” Kevin Hassett may need to visit his favorite hardware store.

by admin· · 0 comments · Employment & Productivity, TLR Wire