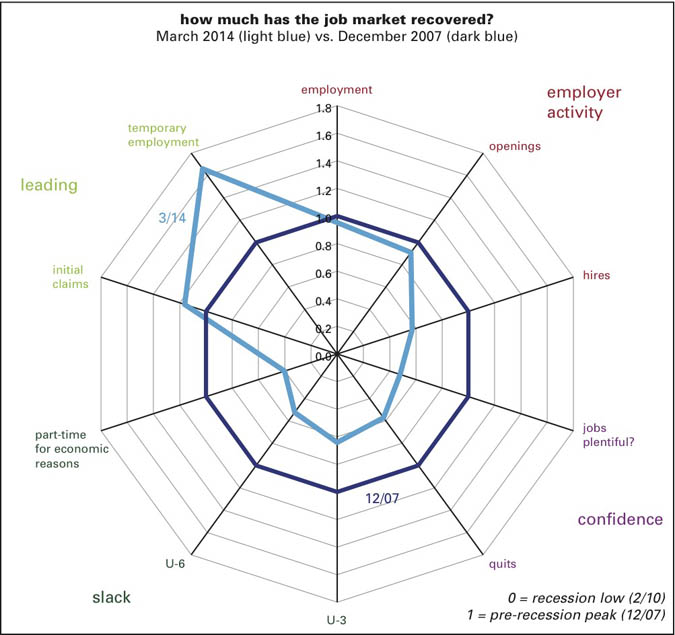
Our Jobs Spider includes 10 employment indicators, grouped as follows:
Employer activity: total payroll employment, job openings, and hires (the last two from the JOLTS series);
Confidence: share of respondents to the Conference Board’s confidence survey reporting “jobs plentiful,” and the quit rate (from JOLTS).
Slack: the headline (U-3) and broad (U-6) unemployment rates, and those working part-time for economic reasons as a percent of total employment.
Leading indicators: initial claims for unemployment insurance and the number of employees at temp firms, both expressed as a percent of total employment.
For this graph, the “standard” is the business-cycle peak, December 2007. All measures are normalized so that they have a value of 1 for that month. The recession low’s values are set to 0. The further away from the center, the further its distance from the recession low. (The value of unemployment measures are inverted, so that a lower unemployment rate is indexed as a higher value.)
The broad picture that emerges is that the measures of employer activity are recovering, with payrolls a hair below their pre-recession levels (a measure that takes no account of population growth), and hires lagging openings; measures of worker confidence are only half-recovered, or a little more; ditto measures of slack; but the leading indicators are well above their pre-recession peaks. If there’s some sort of structural upward shift in the temp share of total employment, the measure may have lost some of its leading properties, but it is by far the strongest indicator on the graph.


