Note: We are looking at long term trends here so this isn’t a big deal, but the Federal Reserve pointed out that Hurricane Harvey is responsible for approximately three-quarters of the decline in the latest industrial production report. Expect the Harvey and Irma effects to be with us for a long time.
Industrial production is the red-headed step-child of coincident economic statistics. The entire market stops, and then quickly restarts, when the BLS releases the employment report. The Census’s retail sales number receives less fanfare, but it does have a certain amount of headline grabbing power despite its unruly nature. In contrast, the Federal Reserve’s industrial production release receives no attention. This is unfortunate, because it contains a great deal of salient information. And there is no disputing its economic importance: according to BEA industry output data, manufacturing is one of the largest contributors to total industry output.
Before looking at the latest report, let’s consider some context:
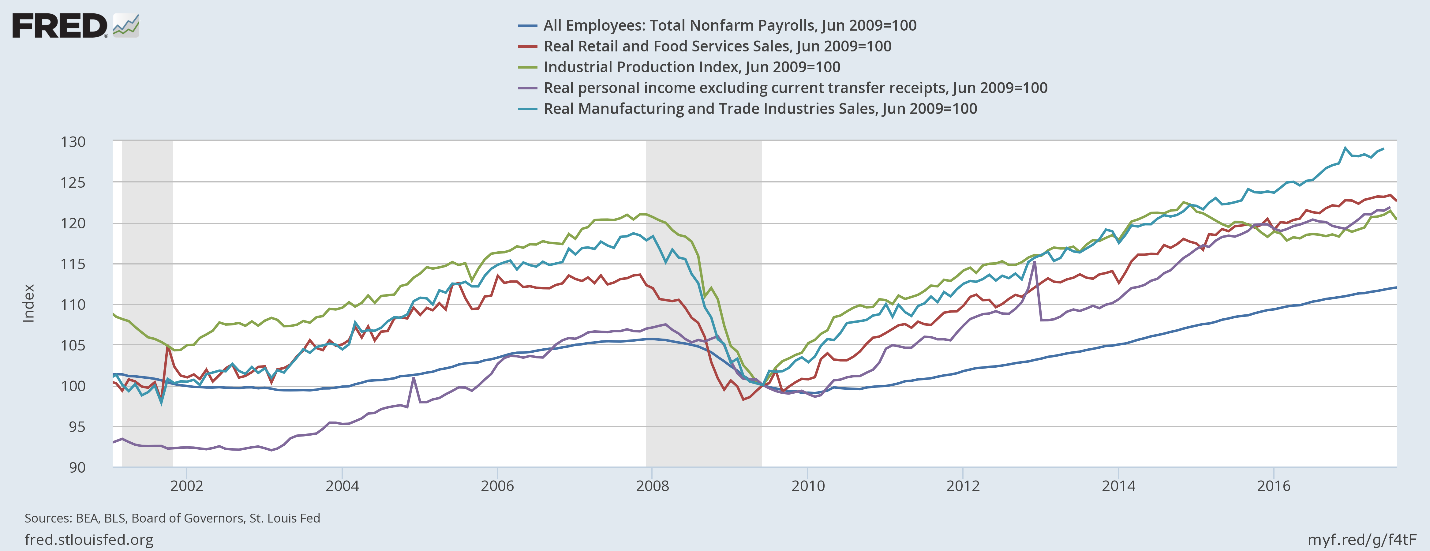
The above chart shows all the primary coincident indicators shifted to base 100. All – except industrial production – have risen above their respective pre-recession highs. It peaked at the end of 2015, dipped for a few years, and only recently increased to higher levels.
Next, consider capacity utilization:
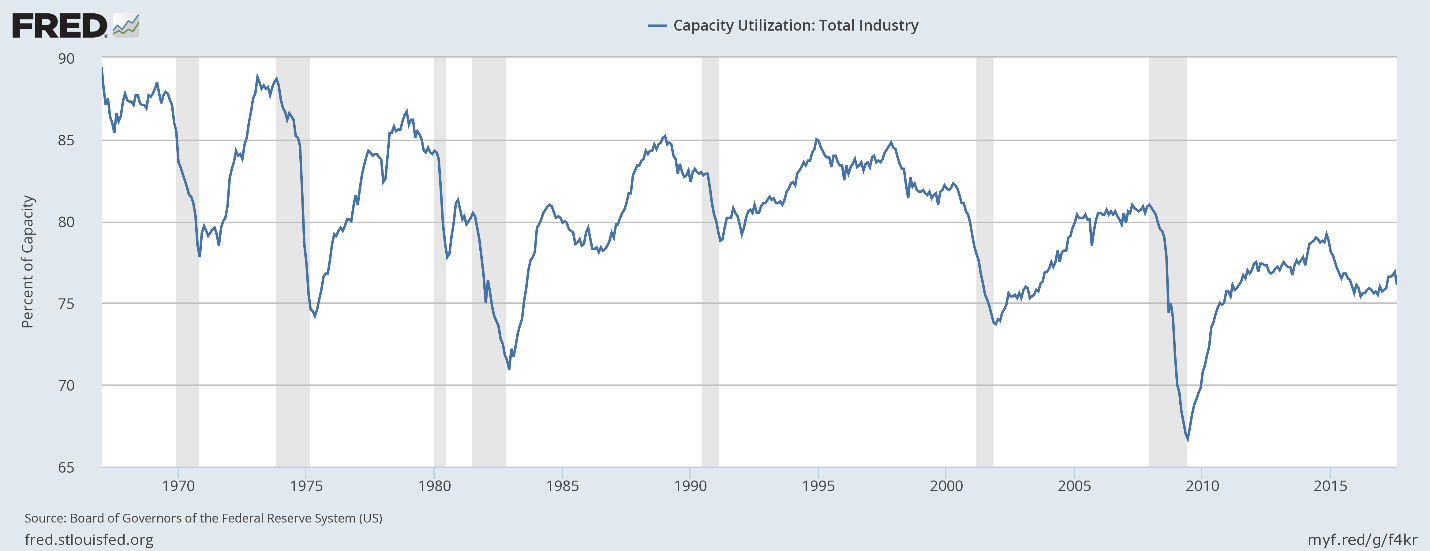
This statistic has hit consistently lower peaks for the last three expansions. This has two important ramifications. First, it weakens investment demand. Why add to your physical plant when you’re employing a lower percentage of it? Second, this may be a fundamental reason for weak price pressures. Why raise prices when instead all you have to do is bring more of your dormant capacity online?
There are two categorization systems used by the Federal Reserve to break down industrial production: major industry groups and major market groups. We will take those in turn.
Major Industry Groups
We’ll break this data down into 4 sub-components, starting with durable and nondurable manufacturing.

Durable manufacturing (in red) first peaked in mid-20124 and again in 2017. But it still hasn’t advanced much beyond its pre-recession level. It’s doubtful it will do so; auto sales are declining and the auto dealer sales/inventory ratio is near a multi-decade high. Non-durable goods dropped about 10% during the recession and only recently started to rise from the pre-recession lows.
Here are the charts of the final two industry groups:
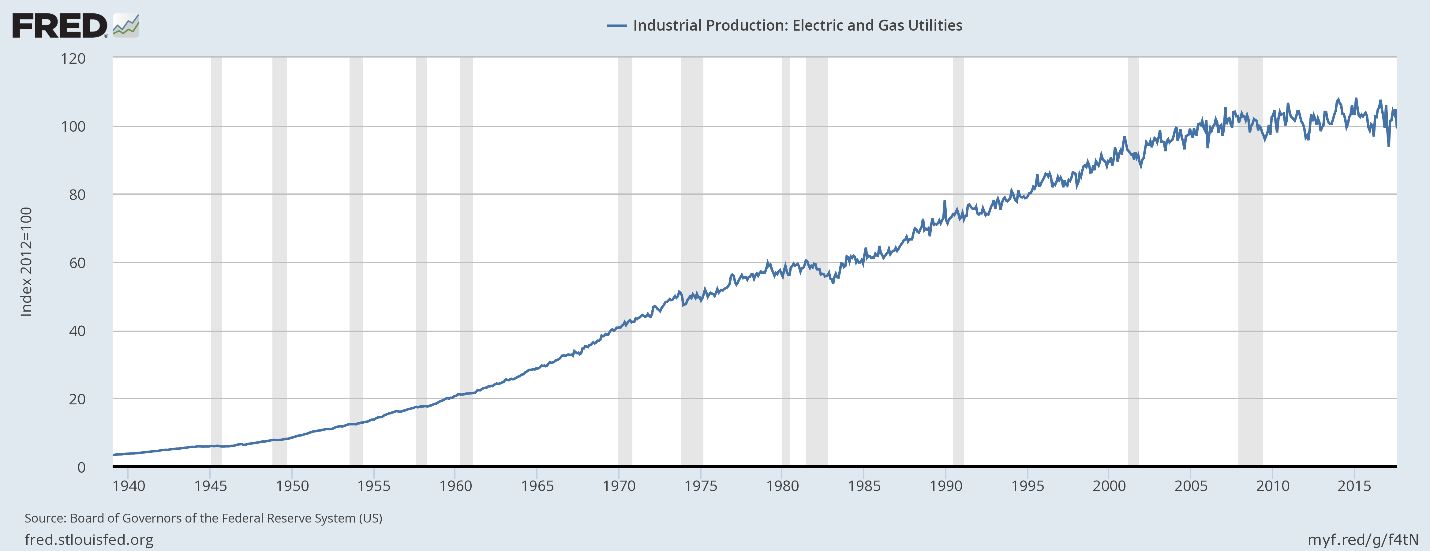
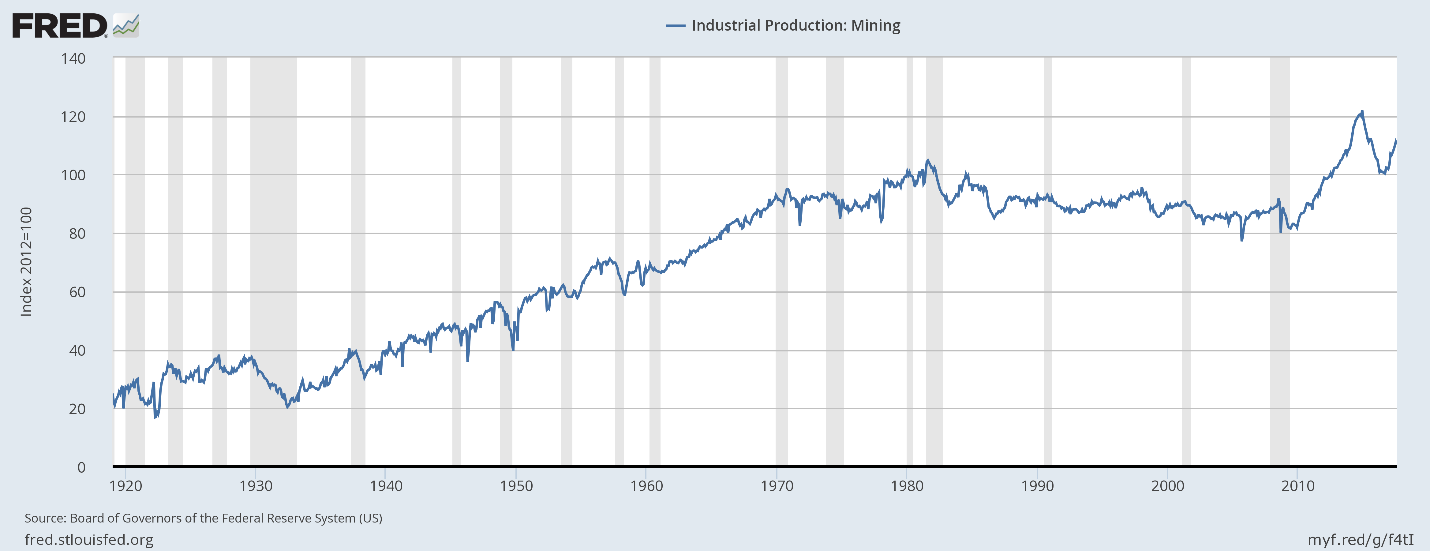
Utilities (top chart) have moved sideways for the duration of this expansion. We suspect increased energy efficiency is having an impact, a good thing. That leaves mining (bottom chart) to provide the sold growth engine. It declined for 30 years (1980-2010) before growing strongly because of the fracking revolution. That has proved to be an unstable thing, but if it weren’t for fracking, there would be no major move in industrial production along industry lines.
Market Groups
Let’s first look at industrial production for consumer goods:
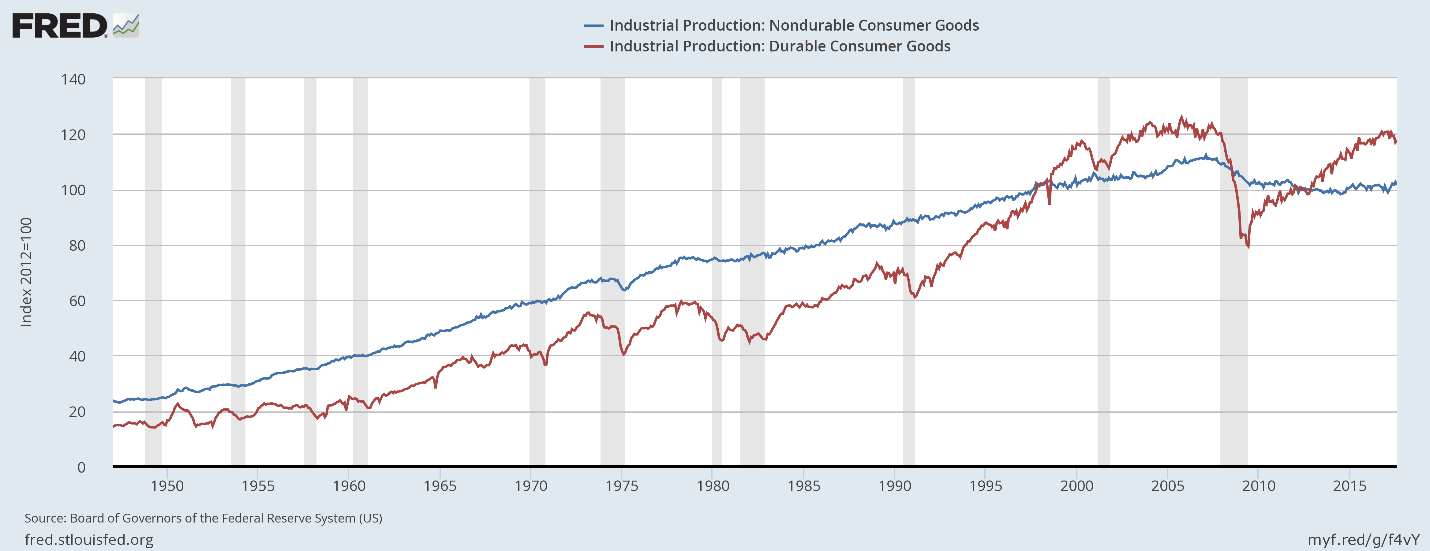
Durable production (in red) has risen to slightly above pre-recession levels, but has yet to move meaningfully beyond that level. Nondurable production (in blue) remains below its prerecession level – so much so that it’s highly doubtful it will advance beyond its previous high.
Next, here is business equipment:
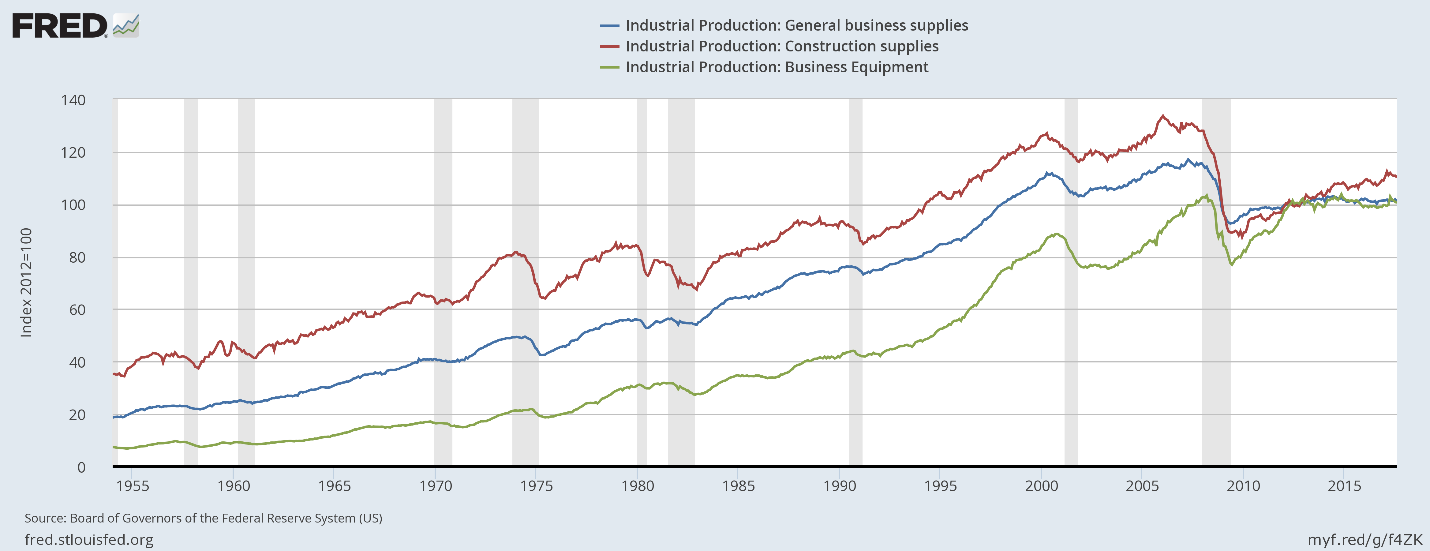
Business equipment (in green) is stuck near its pre-recession level. Construction production (in red) was understandably high during the housing bubble. It dropped sharply during the recession and has been rising consistently since. General business supplies (in blue) is still far below pre-recession levels.
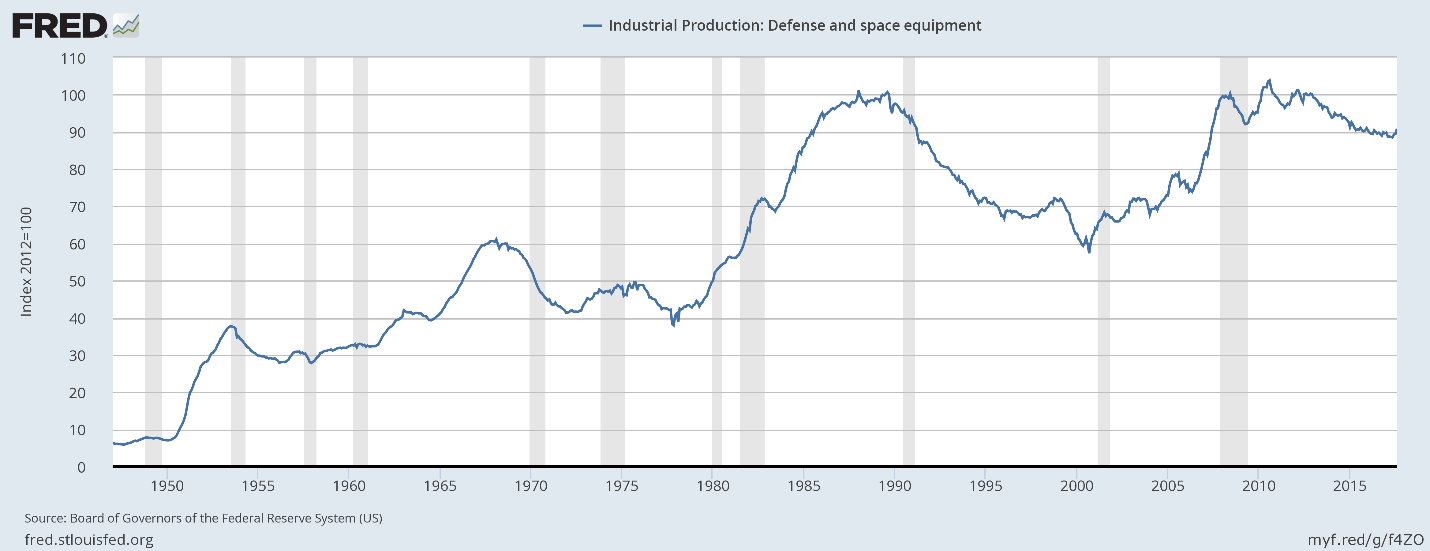
Defense and space production has recently declined:
Next is durables and nondurables materials production:
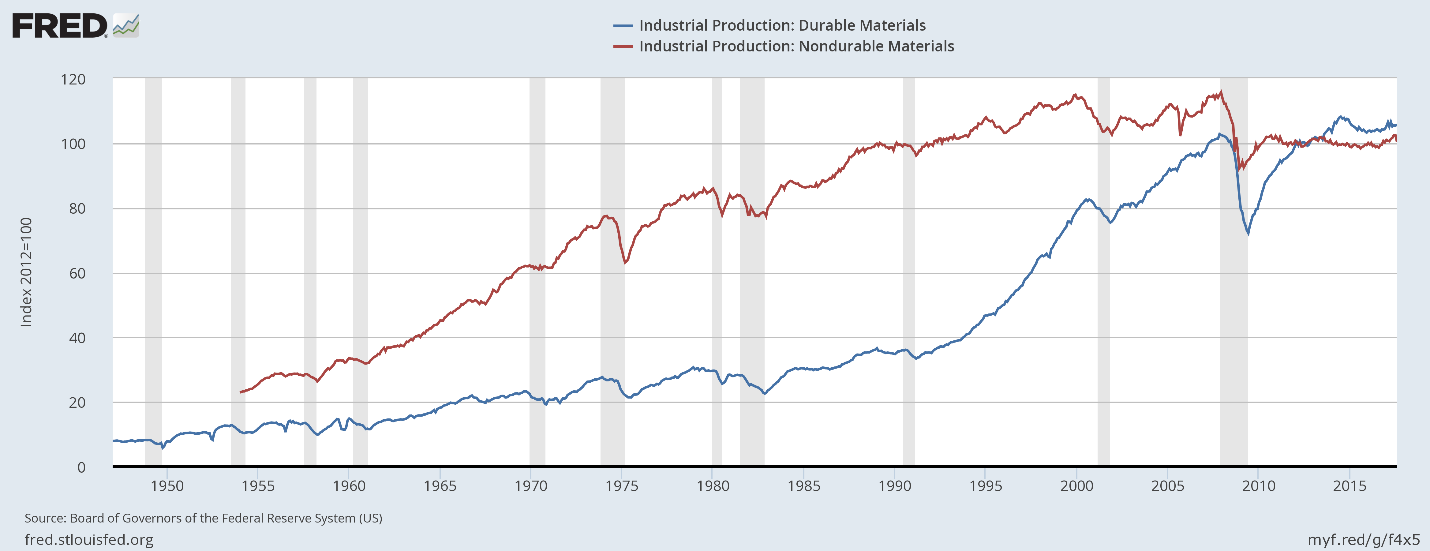
Durables production (in blue) is slightly above it pre-recession level while nondurable goods are sharply lower. There has been no meaningful growth in either measure dor at least several years.
Energy is the last industry classification:

And it is the only one that has meaningfully grown during this expansion.
Regardless of how you slice the data, The United States’ physical production hasn’t grown meaningfully during this expansion. The best performing sector in the consumer areas is durables, and they’re still near pre-recession levels. Overall business supplies levels are also lackluster. If it weren’t for oil, we’d be seeing no growth in industrial production.

