We all know the pandemic has done more damage to employment among certain demographic groups than others. Here are some spider graphs that show the percentage declines into the worst of it, and subsequent recoveries by demographic.
We used employment/population ratios, EPOPs, a straight-forward metric that reports the share of the population that is working, and so gets around all the questions about who has dropped out of the labor force and why that freight the unemployment rate.
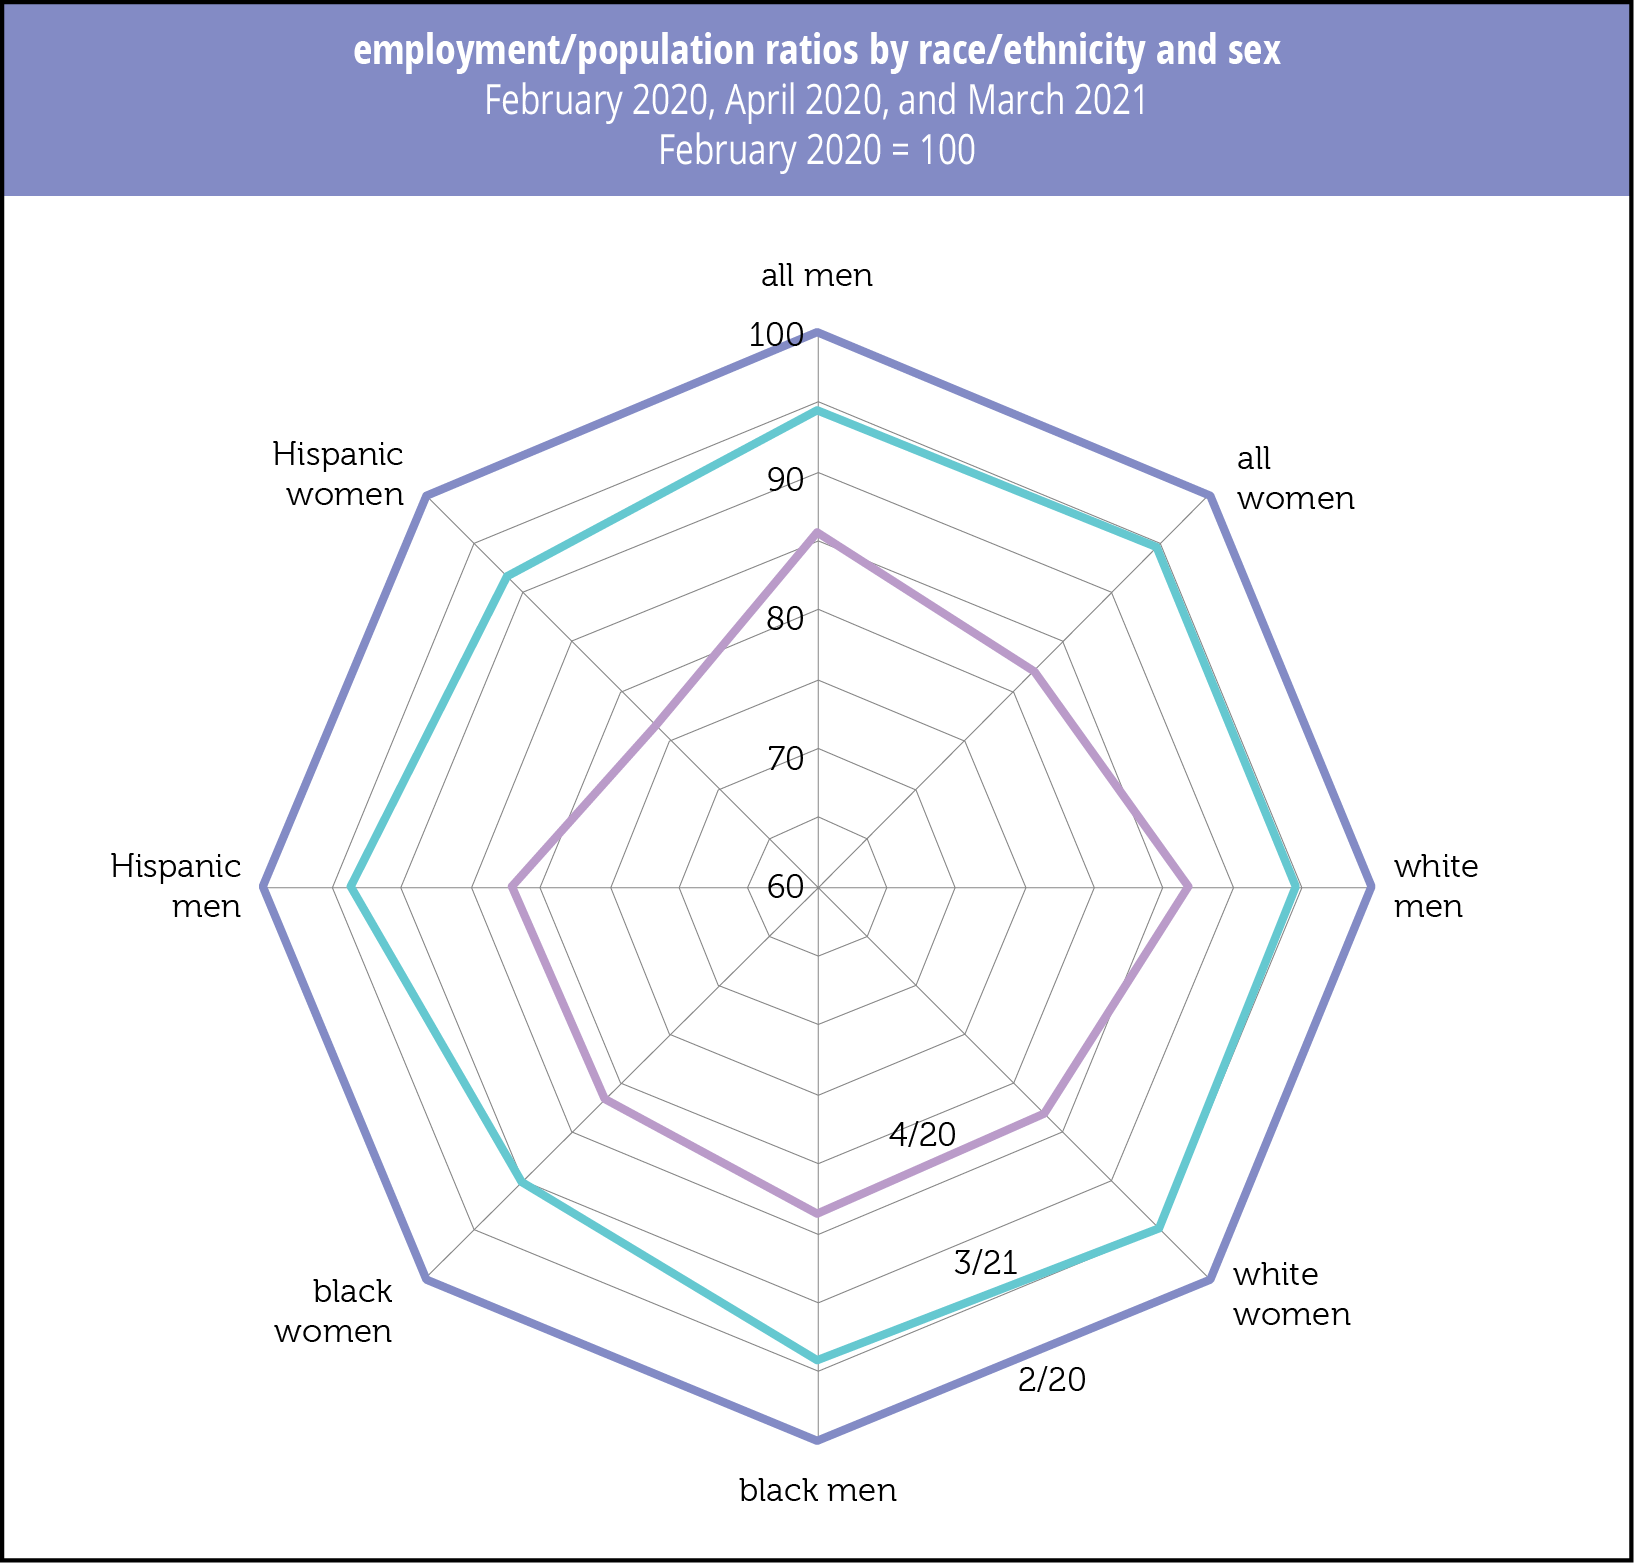
Please note that the EPOP of the most engaged demographic, Hispanic men, is currently above that of all men and of Black and White men before the pandemic hit, despite an initial decline exceeded only by Hispanic women (not graphed).
White men, who experienced the smallest—‘though plenty big—contraction, and White women have made the most progress toward the ratios of February 2020. Hispanic and Black women have farthest to go, which is why you sometimes hear, based on the aggregates, that woman have suffered the most.
Here’s what that looks like:
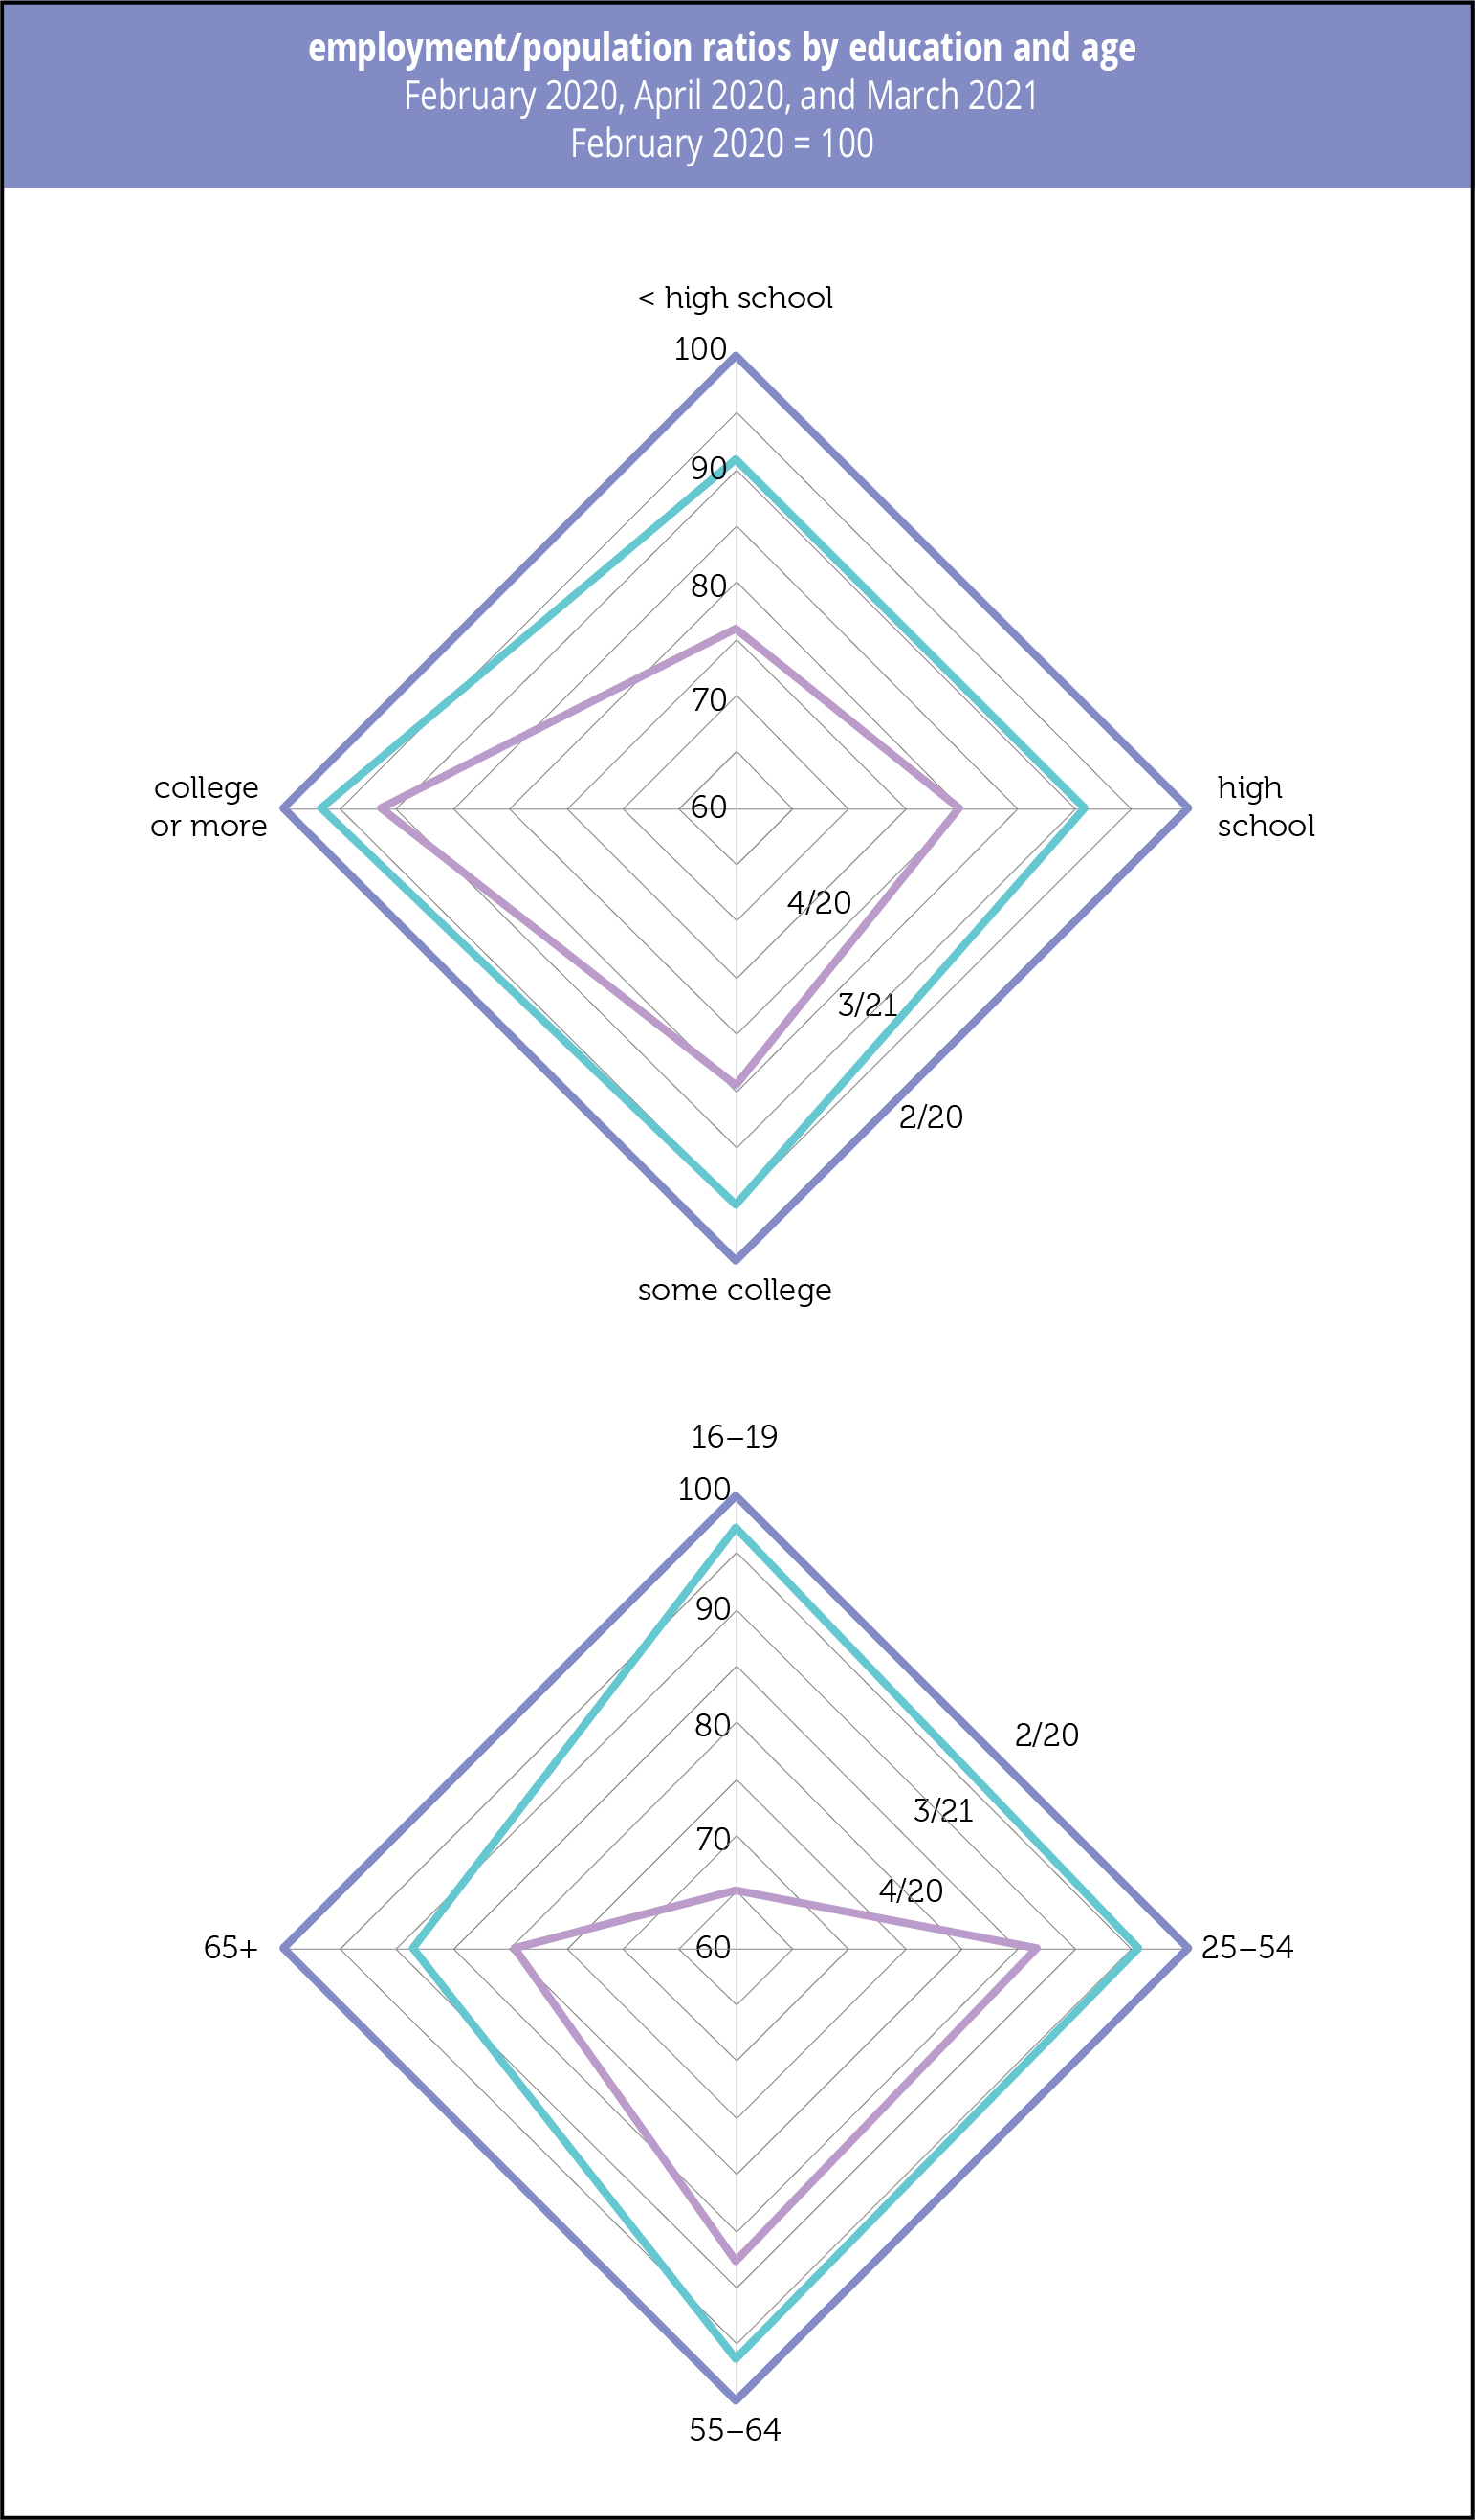
By age, the EPOP fell the hardest among teens, and the recovery is lagging badly among those without college degrees who also experienced the largest setback:
We’ve made many promises to our essential workers. These details will serve as an acid test in assessing our progress.

