Employment & Productivity

A Multi-Century Elevator Ride

In the late 1800s, Native Americans told naturalists working in Alaska that the marbled murrelet, a small seabird that flies underwater when fishing, breeds in the ancient forest. Apparently they weren’t listening. The nesting habits of this small chunky alcid remained a mystery until the 1970s when a tree surgeon working on a damaged branch over a campground in a state redwood forest came across a nest, not a first, with a lone chick, unusual, but a chick that had webbed feet, a first.

One clue had been noticed prior to this discovery, murrelets flying up rivers miles from the ocean during breeding season, and more became apparent after. For example, the species ranges from Monterey Bay to the Aleutians, and its pelagic populations are closely correlated with proximity of old growth forests.

One of the most destructive of our many destructive economic narratives is the claim that economic and ecological outcomes are at odds. Among the most polarized, brutal, and misunderstood of battles engaged by this polarity were the Timber Wars concerning California and Oregon’s old growth forests.


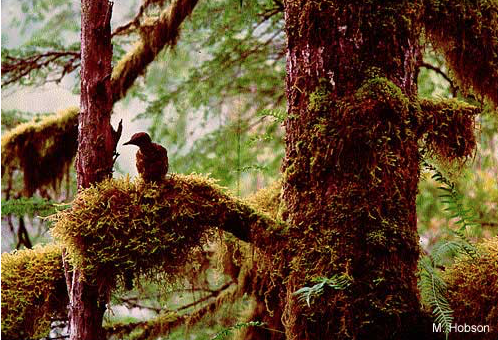
Photo from San Francisco State University linked below. If anyone knows M. Hobson, the photographer, please send him or her our way.

They didn’t have to happen. The team of biologists and historians who put together Coast Redwood, A Natural and Cultural History, details how, in the 1930s, the Pacific Lumber Company, under the leadership of Stanwood Murphy, became a pioneer in sustainable timber harvesting, cutting only certain percentages of trees leaving others to hold the soil together and for future harvest. PL maintained these practices for half a century. Their timber holdings were their major asset, and their employees believed the “extensive holdings and sustained-yield logging would ensure their long-term employment.” The last Murphy to run the company said, “We were the good guys. It was fun, it was easy—it was a great life.”

In the 1980s, Pacific Lumber owned about 70% of the old growth forest held privately. Unfortunately for their employees, PL’s under-valued stock came to the attention of Houston-based Charles Hurwitz and his company, Maxxam, who financed a hostile take-over with junk bonds and, heavily levered, raided PL’s pension fund, and began selling off secondary operations, like a welding shop, and clear cutting to service the debt.

By this time the marbled murrelet’s population had been decimated by logging, declining fisheries, you name it, and its habitats were protected. When PL illegally entered those habitats to log valuable old-growth trees, the Environmental Protection and Information Center, among others, sued PL, eventually taking the suit to federal court, who sided with the environmental groups, noting PL had used “fraudulent wildlife assessing methods,” concerning murrelet populations. PLC’s licenses were revoked for “gross negligence & willful” violations of state forestry regulations, and eventually the land was purchased from PL and taken into public hands.

The marbled murrelet isn’t the only species up there. In the late 1990s researchers led by Humboldt State’s Steve Sillett began climbing into redwood crowns. (If you’ve read Richard Powers’s The Overstory you know something about this, but there’s more.) The crown of one mapped redwood contains 210 trunks and fills 32 cubic yards, the tree itself embodies over 37,000 cubic feet of wood. Within those crowns, in addition to ferns, lichens, mosses and epiphytes, huckleberries produce fruit, and some trees become natural bonsais, while others can grow to 8 feet. Wandering salamanders have been found breeding in water-logged humus mats above 200 feet. Salamanders are good climbers, but it is hard to imagine what would impel an individual to use the energy it would take to make that climb, and some biologists believe centuries ago salamanders climbed onto young trees and rode up as the tree grew, as did generations of offspring. There are also crustaceans and, so far, no one knows how they got there. How many STEM jobs, some entry level, could those aerial habitats also support?

Murrelets begin nesting in April, the chicks fledging at about 4 weeks. Until recently no one knew how the young birds reach the ocean. It has now been observed that they fly out of the nest and to sea alone in the evening dark, another mystery solved.

by admin· · 0 comments · Employment & Productivity

Health effects of Confusing Absolute w/ Relative?

Dr. William Darity, in charge of many things at Duke University, has been steadily advancing his theory of stratification economics, arguing that the ability of one’s parents to contribute to one’s resources is a bigger determinant of economic outcomes than education & hard work. He refers to the fact that blacks who have completed college have only two-thirds the net worth of whites who never finished high school as “one of the most dramatic statistics we’ve discovered.” That dramatic statistic, of course, has long roots.

However, in 2019 Darity, along with epidemiologists Arjumand Siddiqi, and Odmaa Sod-Erdene of the University of Toronto, and others, dug up a worrisome misperception in their report, Growing sense of social status threat and concomitant deaths of despair among whites. Revisiting Anne Case and Angus Deaton’s white “deaths of despair,” they add a third hypothesis to the two already out there, which include either the long-term or the contemporaneous decline in economic conditions driving the alarming trend in mortality.

Darity et al. find that the rise is not restricted to the lowest education groups, but is penetrating “deeper into the education distribution,” although with the most damage occurring among those with lowest educational attainment, and argue that economics alone cannot explain the increase in mortality among whites. If that were the case, the death rate among blacks, who are experiencing “parallel trends, and at more adverse levels,” would also be rising, but it was not pre-Covid. Instead, they point out that demographic groups tend to evaluate their positions relative to other demographic groups, not their peers, and that a rising misperception among whites that their social status is being undermined is a better explanation. Racial and economic anxieties are entangled.

“For perhaps the first time, we are suggesting that a major population health phenomenon – a widespread one – cannot be explained by actual social or economic status disadvantage but instead is driven by perceived threat to status.”

They call their findings stunning and startling, and we’ll add hard to wrap your head around. But if you have the stomach to read some of the racist and anti-Semitic claims being thrown around these days, their hypothesis is definitely worth some thought.

by admin· · 0 comments · Employment & Productivity

Racial & Ethnic Disparities in EPOP Recoveries

Employment-population ratios have been recovering: the overall EPOP had regained 54.1% of its February-April loss by September, and 62.2% through December. However, in the last two months only half the major demographic groups retained traction, so November and December overall were flat.

That’s graphed below, and here are some highlights: Men overall have gained 5.2 points of their loss, about half women’s 10-point recovery. White & Hispanic women have turned in stronger performances than men, contradicting a popular meme that played off women’s weakness in December.

Women’s EPOP fell by 10 points between February and April, and has regained 6.4%. Men lost 9.6 points and regained 5.7. But since women started with a lower EPOP than men, these translate to larger percentages. However, in December the EPOP for women was 83% of that of men, close to February’s share, after having fallen to 80% at the April low.

Racial and ethnic disparities are far greater than those of gender. Black and Latino EPOPs fell harder than whites’ and have recovered less, with black women showing the weakest recovery of any of the demographic groups shown. One thing dragging down the recovery among black workers is almost certainly the continuing decline in government employment, where they’re heavily overrepresented, with many jobs earning good pay.

by admin· · 0 comments · Employment & Productivity

May state employment: At what cost?

The Bureau of Labor Statistics released state-level employment data for May this morning. Looking over the last two months, where things stand since March, largest job losses are in Hawaii, Michigan, New York, and Nevada, all around 20%. There’s a big cluster of states that lost about 15% of their employment over the two months, including the Eastern states not listed above, and Kentucky. Clustered just above 10% are many large Western and Midwestern states, West Virginia, North Carolina, and New Mexico. Those down 10% and less include more of the Southern states, and the Plains and Mountain states. Smallest two-month declines were in Oklahoma and Utah, -6%, followed by Arkansas, Arizona, Idaho, Mississippi, and Nebraska, all -7%.

Our diffusions indexes, which were all 0 in April, except one case of construction hiring, rose to a broad 49 overall, with Leisure & Hospitality, 49, leading the way, followed by education and health, 47, trade/transport & construction, 46, and professional/business services 38. Government work was up in only 2 states, Wisconsin and New Mexico, and DC.

Looking at Leisure & Hospitality employment, only the District of Columbia and Hawaii added to April losses in May, now down 63% for the two months combined. In Oklahoma and Montana L&H work is down only 10% over the two months, and New York, -56%, Massachusetts, -52%, with Delaware & Michigan, 49%, close behind. The largest losses are heavily concentrated in the Northeast and Midwest, with L&H employment off between 40 and 63% in fifteen states. California, Oregon and Connecticut are at the bottom of that column, within striking distance of -40%.

Losses of, very roughly, 10%, in Oklahoma and Montana, to 35%, Maine, Ohio, Wisconsin, are concentrated in the Mid- and South-West, the mid-Atlantic, and the Southeast. Losses in the Plains states all round to about 20%, and in the Mountain West and across the Southwest generally to the high teens. In Utah, Idaho and Tennessee L&H losses total about -15%. None of this is surprising, and there does seem to be a relaxation between more lax state policies, for now. L&H work in Alaska is down 25%.

This is a noisy series with small samples. Largest declines in unemployment rates occurred in Mississippi & Kentucky, around -5.6 pps; in Indiana, Nevada & Arizona, around 5pps; in Vermont, Ohio, Alabama, and Tennessee, around -4pps. Unemployment rates rose in Minnesota, Connecticut & Florida, and lost less than 1 percentage point in Texas, Wyoming, New York, and Alaska.

We’d be more encouraged by all of this of 8 more states hadn’t crossed over the line into the “spreading quickly” red zone this morning in the tracker we sent around on Monday.

by admin· · 0 comments · Employment & Productivity

Diminishing Dynamism

The BLS is just out with the Business Employment Dynamics (BED) release for the first quarter of 2019—not exactly breaking news, but of longer-term interest. First quarter gross job gains fell to 5.9% of employment from 6.3% of employment in 2018Q4, while gross job losses slipped only from 5.6% to 5.5%. A year earlier the numbers were 6.1% (gains) and 5.5% (losses). Not only were net gains weaker in 2019Q1 than 2018Q1, job turnover, the combined total of gross gains and losses, 11.4% vs. 11.6%, is down, further evidence of the eroding dynamism of the US economy. From 1992 to 2000, turnover averaged 15.5% of employment; from 2001–2005, 14.2%; since 2010, 12.1%.

BED also includes stats on establishment openings and closings, which is important because employment growth is driven by young (but not newborn) firms. New establishments grew 3.1% in the first quarter, pretty much where they’ve been since 2010. That compares with 3.4% growth in the 1990s and 3.3% in the early 2000s. Despite the unchanged birth rate, the number of jobs produced by these newborn establishments fell to 0.6% of employment, tying the all-time low for the series. Establishment deaths are only reported with a three-quarter delay (gotta make sure they’re dead and not just asleep): closings were 2.9% of the total, up two ticks from the previous quarter, and also 0.2 above the average since 2010. The gusher of entrepreneurship that was supposed to flourish under a regime of tax cuts and deregulation has yet to materialize.

Further evidence of that comes from the Census Bureau’s business application series, which is derived from applications for new employer ID numbers. From those, Census derives a subset with a high propensity of producing a payroll. Third quarter figures were released on October 16. They showed an 0.5% overall decline in applications from the second quarter, an 0.7% decline in high-propensity formations, and a 2.1% decline in those with planned wages. For the year, new applications were off 1.5%, and off 0.8% for high-propensity ones. As this graph shows, there was a brief surge in formations in 2017 and 2018, but that burst of animal spirits looks to have run its course.