Articles by: admin

We’re Not All Theme Parks

Regional Economic Models Inc. recently hosted two webinars showcasing uses of their models in valuating two specific resources in Florida. In The Bridge to Space the SR 405 bridge that links the Kennedy Center and Patrick Air Force base to the mainland was under the ‘scope, and another focused on the Wekiva River, one of Central Florida’s few near-pristine river systems, a National Wild and Scenic River comprising over 110 square miles, including 42 miles of flowing water, and 34 named springs.

Years ago damage to the SR405 bridge, from age, hurricanes and water rise, made it increasingly hazardous for “heavy aero-space payloads,” and Luis Nieves-Ruiz, of the East Central Florida Regional Planning Council, was called in to assist local planners on the pros and cons of replacement using models, some that his team developed. Replacement turned out to be a true no-brainer: annual spending by tourists alone was found to be twice the replacement cost, even without the big assist from U.S. DOT. Permitting is now underway, securing over $300 million in annual tourist spending, and billions in corporate sales and GDP, not to mention big science.

Although the price tags on the Wekiva River are much lower, it is also crucial to its region. Nieves-Ruiz’s estimates run to 429 jobs, $51 million in output sales, $19 million in personal income, and a $30 million add to GDP. And property values. (As that old California joke goes, prices on the Pacific Coast Highway are much higher for even-numbered addresses.) A degraded river system puts minus signs before those numbers.

Photograph from Florida State Parks

According to Nieves-Ruiz, Florida’s springs are developing some issues with algae, brought on in part by water being transferred to development and away from stream flow, a particularly dangerous situation since Florida’s water supply is almost entirely reliant on aquifers. Nieves-Ruiz notes that remediation is more expensive than protection.

And we’ll add not always possible, and we’re still in the early stages of understanding our natural water systems. For example, it was only in 2013 that the aquifers under Australia, North America, China and South Africa’s continental shelves, holding something like half a million cubic kilometers of low-saline water, came to light. And we now understand that, remediation efforts notwithstanding, the deep organic soils in our water-systems take thousands of years to develop.

Local, targeted work, such as these studies, that reprices the unpriceable, our natural jewels as Nieves-Ruiz put it, shows us the many paths to a sustainable economy. Although he didn’t say it like so, Nieves-Ruiz corrected the local practice of applying the much higher daily spending of theme-park visitors, with their full-service hotels and high-ticket prices, to visitors to the Wekiva system, with their “primitive camping” and canoe rentals.

And that’s kind of the point. Keeping these lower priced activities whole is part of the critical local netwok that safeguards the entire state’s water supply.

by admin· · 0 comments · Comments & Context

Shady Jobs

Who knew that over 140 million acres of American forests grow in cities and towns, and trees occupying that 3.6% of the land in the lower 48 are responsible for close to one-fifth of the nation’s carbon capture? That popped out of recent study on projected growth of urban forests and climate change mitigation at the county level from the venerable American Forests, a not-for-profit working for better outcomes since 1875.

Linden flowers at the Illinois Institute of Technology

Yet those urban forests grow inequitably. In their introduction, American Forests’ scientists note that with a few exceptions, canopy cover in urban areas functions well as a map of urban inequality. Average canopy coverage in urban areas is about 39%. Within that, a recent study found that in formerly redlined neighborhoods canopies cover 23% of the space, whereas neighborhoods given high ratings, characterized by US-born white populations, had close to twice the canopy, 43%. In the authors’ own words, the “ranking system used by the Home Owners’ Loan Corporation in the 1930s parallels the rank order of average percent tree canopy cover today.” Quite the factoid.

Urban forests will expand with expansion of urban areas, but American Forests projects canopy coverage to decline to 33% by 2060, losing out largely to impervious cover. At the same time acres of rural tree cover will fall to construction equipment.

Under a Chicago River bridge

American Forests calculates that to offset loss of ecological services provided by urban forests if tree loss continues at the current rate, we would need to plant 23 million trees a year, one new tree a year for every 3 acres of urban land, which could be accomplished if each urban resident planted one tree every 12 years. An unlikely scenario.

But to do the full job, which would both balance their Tree Equity Index, and ameliorate the air pollution and heat-related illnesses that concentrate in poorer neighborhoods, we would need to plant and maintain 31.4 million trees a year, which would increase average canopy coverage to 43%. (And yes, it would be more efficient to do a better job protecting canopies, but that’s unlikely too.)

Green versus fossil fuel job projections are politicized, of course, and American Forests forecasts the full reforestation project would support 228,000 jobs annually, jobs that can’t be outsourced. American Forests’ efforts are targeted to people of color, and would provide outdoor work that might allay ongoing fears of covid infection and bring people back into the labor force. Nowhere near enough, but a start, and three times the jobs currently in shale extraction, despite much larger gains theorized by industry-funded research as the so-called Shale Gale was gaining steam a decade ago. (For reference, natural gas extraction, broken out in Quarterly Census of Employment and Wages but not in the Current Employment Statistics, was 30,000 in March of 2021. Toss in a representative share of support activities, and you’re at 75,000.)

And talk about bottlenecks. As many as aware, home gardening encouraged by covid has created shortages in fruit trees, but seedling production itself has been in long decline, exacerbated by the Great Recession. American Forests suggests we need to double seedling production to meet our reforestation goals, and, since nursery and reforestation jobs tend to be in economically depressed rural areas, unlikely to grow on their own these days, there’s an offset to our rural/urban inequality here as well. And it could break up worrisome concentrations of, say, poultry processing in the rural south.

Seedlings along the Chicago River

In addition to those jobs, American Forests’ project, currently underway, would, as the trees mature, absorb 9.3 million tons of carbon, remove 57 tons of particulate pollution, and save the country $5 billion in combined air, water and climate services annually. That $5 billion alone is over half the cost.

American Forests’ tree equity tool, a targeted resource, covers 150,000 neighborhoods and 486 municipalities that constitute 70% of the US population, including socioeconomic status, population density, and current canopy cover. You can evaluate your own community as well as compare your own community to others here.

Large cities with the most to gain include Chicago, Detroit, Houston, Los Angeles, Memphis, New York, Oklahoma City, Philadelphia, and Portland.

Innovation Coda
Ben Christensen & Marisa Repka of Cambium Carbon, based in DC but operating nationwide, just won the JM Kaplan Fund’s innovation award. Thirty-six million trees fall in US cities each year, and their outfit, Cambium Carbon, creates a regenerative economy by salvaging those 46 million tons of wood, and using the proceeds to fund new tree planting, as well as keep usable material out of the waste stream. Might as well get with the terminology, so upcycling that wood into valuable, and scarce these days, durable goods brings local residents, many of whom face barriers to traditional employment, into the force where they learn technical skills across the tree life cycle, from tree care to carpentry.

Christensen and Repka had the idea when working with the World Resources Institute, observing that the kind of projects coming into the climate space from the financial sector, from private industry, and from the government, were all weak in terms of scalable projects. In their words, by transcending scale, their operation will bridge the “giant gap between supporting communities with the grace and specificity required to build effective local solutions…and the ability to scale those solutions into national climate initiatives.”

Their tagline? “Our wood does good.”

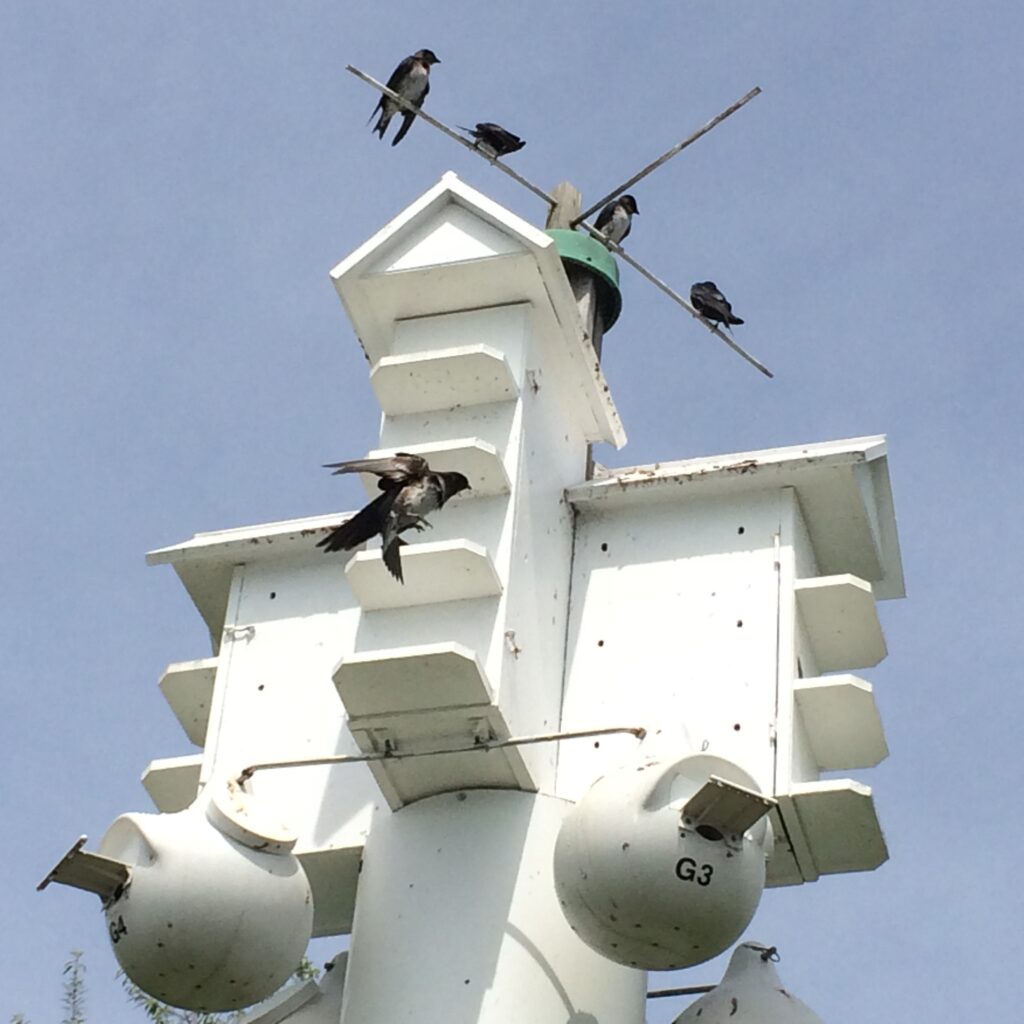
Purple Martins nesting along Lake Michigan

by admin· · 0 comments · Employment & Productivity

Frontier Knowledge & Start-Up Quality

In their 2015 research paper “Where is Silicon Valley?,” Jorge Guzman and Scott Stern set out a new method of ranking entrepreneurial ventures focusing on quality, not quantity as had prior reports, in part to provide policy-makers with information on how to promote entrepreneurship for economic and social progress.

They assemnbled five metrics, firm-name characteristics (named after the founder, long, short?), is it local or part of a regional trading cluster or high-tech industry cluster; is it a corporation, LLC, or incorporated in Delaware, and does it gain control of formal intellectual property rights within one year? They do not include location in order to step around the pitfall of assuming that businesses in a given location have a given level of quality. The quality metric is the probability of an initial public offering or an acquisition within 6 years of founding.

Their results are not surprising, but some of the magnitudes may be. Of course in California Silicon Valley stands out, with a quality ranking 20 times the average, and 90 times the lowest ranked cities. Quality is tied to the proximity of research universities and national labs. Finally, the high stakes are apparent in the difficulty of reaching the growth metric: Even those firms ranked in the top 1% have just a 5% chance hitting it.

Fast forward to 2021 and More than an Ivory Tower, the Impact of Research Institutions on the Quality and Quantity of Entrepreneurship, by Valentina Tartari and Scott Stern, who take on the possibly circular logic of the relationship of research institutes and start-up quality. (The former are often located in innovative environments and can themselves be sources of demand.) Three steps gets them there: assess annual business registration records using the analytics outlined above by zip code; link to presence or absence of research university or labs; and consider changes in Federal funding of those institutions, and whether it is directed to research or other activities.

They found that changes in Federal research commitments to universities are “uniquely linked” to positive changes in the quality-adjusted quantity of entrepreneurship, but that increases in non-research funding to universities as well as research funding to national laboratories has either neutral or no impact. In their conclusion they underscore that their research supports MIT’s Jonathan Gruber and Simon Johnson’s argument laid out in Jump-Starting America, for establishing a set of regional innovation hubs to support local “entrepreneurial ecosystems,” outside the established “superstar” hubs.

They suggest that although universities and national labs both conduct significant research, universities distinguish themselves both by also producing students, who often launch start-ups in the area—they suspect students with frontier knowledge play an important and “often underappreciated” role in disseminating knowledge generated at universities to activities in the private sector— and by promoting “policies and rules that encourage openness” and enhance “fluidity between research and industry.”

One of the reasons researchers so dislike non-competition employment constraints.
There’s much more, including interactive maps, from the team at Start-up Cartography Project.

by admin· · 0 comments · Uncategorized

Damage by Demographic: An Acid Test

We all know the pandemic has done more damage to employment among certain demographic groups than others. Here are some spider graphs that show the percentage declines into the worst of it, and subsequent recoveries by demographic.

We used employment/population ratios, EPOPs, a straight-forward metric that reports the share of the population that is working, and so gets around all the questions about who has dropped out of the labor force and why that freight the unemployment rate.

Please note that the EPOP of the most engaged demographic, Hispanic men, is currently above that of all men and of Black and White men before the pandemic hit, despite an initial decline exceeded only by Hispanic women (not graphed).

White men, who experienced the smallest—‘though plenty big—contraction, and White women have made the most progress toward the ratios of February 2020. Hispanic and Black women have farthest to go, which is why you sometimes hear, based on the aggregates, that woman have suffered the most.

Here’s what that looks like:

By age, the EPOP fell the hardest among teens, and the recovery is lagging badly among those without college degrees who also experienced the largest setback:

We’ve made many promises to our essential workers. These details will serve as an acid test in assessing our progress.

by admin· · 0 comments · Employment & Productivity

In the Labor Force & in Poverty

According to a recent Bureau of Labor Statistics report there were 34.0 million people, or 10.5% of the population, living below the poverty level in the United States in 2019. Although these are “primarily” adults who are not in the labor force, and children, 6.3 individuals constitute the working poor, those who were in the labor force for at least 27 weeks, working or looking for work, but whose incomes remain below the poverty level. But, that population as a share of all individuals who were in the force for the requisite weeks, fell to 4.0% in 2019, the lowest in the series that goes back to 1986, from 4.5% in 2018. In 1986 the rate was 6.2%, dropped and then rose to 6.7% in 1993, fell into 2001, topped out at 7.2% in 2010, and has been steadily falling with a mini plateau in 2017-18.

Full-time employment (FT) helps a lot, with only 2.7% of those working FT among the working poor, but 9.8% of those working part-time. Women are “more likely” to be among the working poor, 4.5%, than men, 3.5%, and Blacks and Latinos are “much more likely” than Whites and Asians to be so classified. 2.3% of Asian workers earn wages below the poverty level, as do 3.5% of White workers, 7.0 of Hispanic workers, and 7.2% of Black workers. Asian men, 2.4%. have a higher rate than women, 2.3%, but rates for women are higher in all other demographics. The highest rate, 14.5%, is among black women aged 24 to 34 or in their teenaged years, followed by Black men aged 20-24, 10.7%.

Education matters, but it’s no shoo-in. About eleven percent of white workers with four years of high school yet no diploma earn poverty wages, as do 22% of Blacks, 13.9% of Hispanics, and 7.5% of Asians. Overall, only 1.4% of those with Bachelor’s degrees are among the working poor, no difference between men and women. Although white women with BAs are only 0.1pps more likely to be in poverty than men, 1.4%, 1.9% of Black women with college degrees rank among the working poor, as do 0.8% of men, the smallest share. That breakout is reversed among Asian workers, with women at 0.9%, while among Hispanic workers, women are above, 1.9%, and men a bit below, 1.6%, the average, 1.7%.
One fifth of families maintained by women with a child under 18, a demographic we and many others consider highly motivated, earn wages beneath the poverty line, more than twice the share of families maintained by men, 9%. Families with children under 18 and one person in the labor force were five times as likely to live in poverty as those without children.

by admin· · 0 comments · Employment & Productivity