Risky Balance Sheets: IMF Confirms TLR Worries
For some time now, TLR has been pointing to risks in rising nonfinancial corporate debt levels – a sharp contrast with the deleveraging that has been going on in the household and financial sectors. In its latest Global Financial Stability Report, out this morning, the IMF confirms our worries, offering considerable detail on the nature and risks of increasing corporate leverage.
The IMF makes several points, among them:
• Even with a cut in corporate tax rates, many firms would be too cash-constrained to increase capital spending – which is the economic rationale for such a policy change. Three sectors in particular – energy, utilities, and real estate – which together have contributed almost half the capital spending among S&P 500 firms in recent years, would find it difficult to boost investment. “Perhaps more important,” writes the IMF, “cash flow from tax reforms may accrue mainly to sectors that have engaged in substantial financial risk taking,” like purchases of financial assets, M&A, and dividends/buybacks. Such spending, the Fund notes, has accounted for more than half of free corporate cash flow since 2012 (another risky practice we’ve been highlighting in our quarterly reviews of the Fed’s financial accounts).
• Despite high equity valuations, firms have chosen to buy their own stock rather than floating fresh shares, and have often been using debt to finance the buybacks.
• Corporate credit quality, as measured by weakening covenants and rating downgrades, has been deteriorating – and not just in the energy sector. Capital goods and health care are looking dodgier as well.
• Leverage ratios are rising as credit quality deteriorates. (See graph below. All graphs from the IMF report.) Median debt of S&P 500 companies is close to a historic high of over 1.5 times earnings – and it’s not just energy. A broader universe of 4,000 companies, accounting for about half of all U.S. corporate assets, is approaching levels last seen just before the global financial crisis.

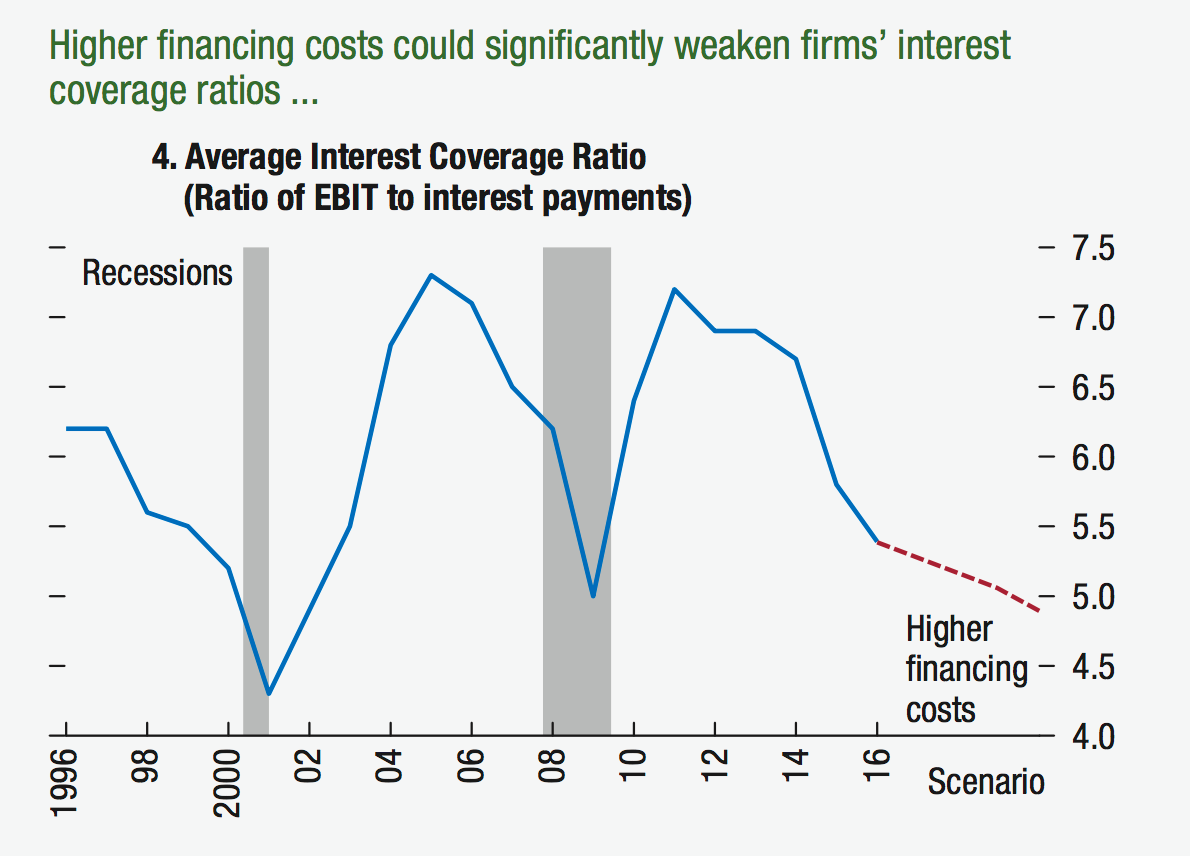
• Despite low interest rates, debt service ratios have fallen dramatically, as shown on graph below. Interest coverage is less than six times earnings, a ratio below what we saw before the financial crisis, and on a par with what we saw in 1999, just before the dot.com bust. Should tax cuts lead to wider budget deficits (which are not terribly high right now) and higher interest rates, interest coverage ratios could decline further.
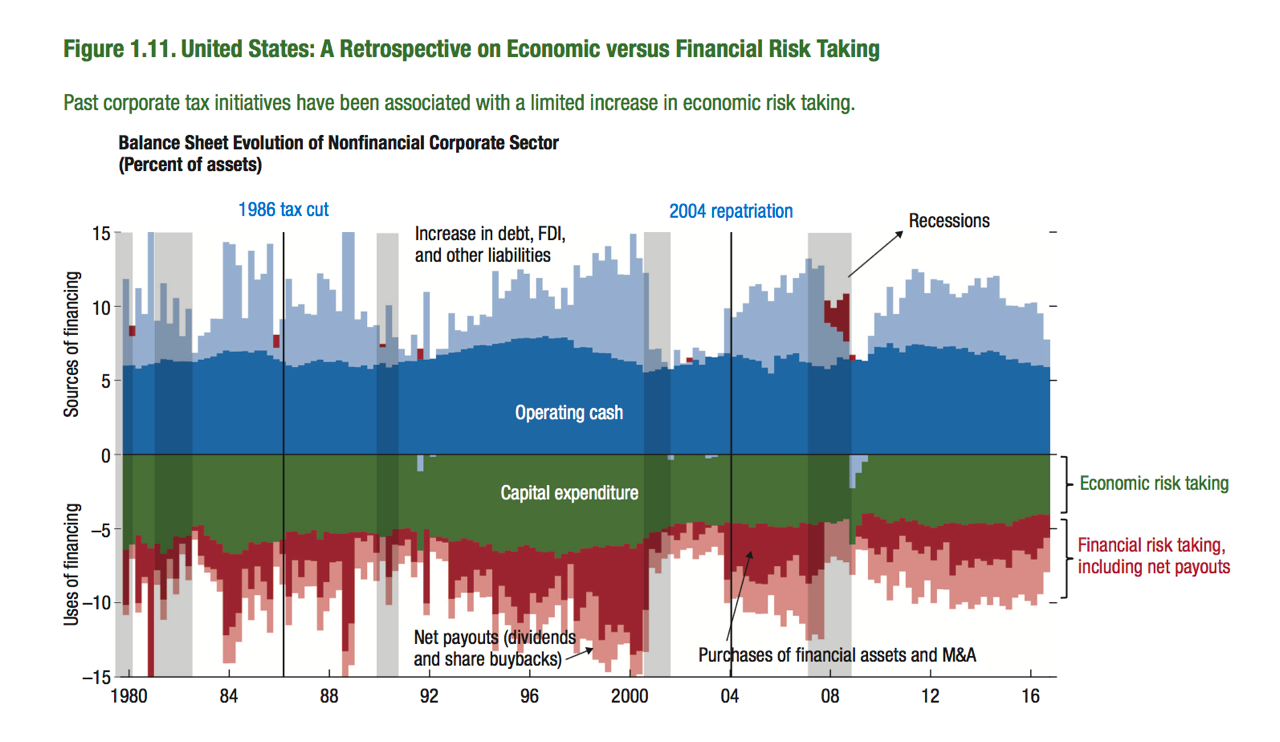
• You might think that a cut in corporate taxes and moves that would allow the repatriation of funds stashed in tax havens abroad might ease the situation, but the IMF warns against those comforting thoughts. As shown on the final graph, the 1986 corporate tax cut and the 2004 repatriation led not to a reduction in debt or an increase in capital spending, but an increase in financial adventuring. Were such measures accompanied by a weakening of financial regulation and oversight, things could get very bumpy.


All This, and Indentured Servitude Too
It’s no secret that many of our more vulnerable workers have it tough these days.
In July, the Treasury Department decided to take a look at the widespread use of non-competition agreements among low-wage workers as a factor in ongoing low job churn and wage growth.
Additionally, Case Western law professor Ayesha B. Hardaway is looking into the proliferation of these “non-competes” among low-wage low-skill workers as a condition of their at-will employment as a violation of the 13th Amendment. She argues that Reconstruction Era debates, legislation passed after the amendment itself, and judicial opinions of the time make it clear that the prohibitions against indentured servitude and peonage in the broader amendment were intended to prevent wage slavery.
Which is what you get if you put at-will employees on this particular one- way street. They are not protected by contracts and, since they cannot seek like similar employment elsewhere, have no bargaining power.
And therefore no economic mobility. Hardaway argues that such use is outside the original scope of post-employment restrictive covenants, which were designed to protect trade secrets, thereby encouraging employers to invest in new ideas and in the training of their employees.
Restrictive employment covenants have been addressed by the courts for centuries, and US legal thought on such matters came, originally, from British courts in the 16th century. These courts generally put attempts to restrict work opportunities of former apprentices under the rubric “improper and unethical motives of masters.” Specifically, applying the rule of reason, the court stamped the idea that an apprentice could not seek employment in the “very trade he honed during his apprenticeship to be morally improper and outside ordinary norms.” Such thinking on employment restrictions held in England, although specific confidentiality clauses, and non-solicitation and non-poaching agreements, Hardaway’s “original scope,” generally got the green light.
And so it was in America until the late nineteenth century, when judicial decisions began to wear away the precedent set by the test of reason. Even so, through the twentieth century such agreements were limited by the courts to high-level employees with access to proprietary information, employees whose names and reputations themselves often added value to the company. These sophisticated workers are on a two-way street: at the same time they sign such agreements, they also sign employment contracts.
Hardaway believes that subjecting low-wage un-skilled workers to similar arrangements “fails to comport with the established rule of reason.” Indeed, and worth thinking about with the Politics of Rage getting so much ink these days.