AI is making enormous demands on electricity grids around the world. Exactly how enormous isn’t easy to say, since statistical agencies aren’t reporting the AI sector separately and the companies themselves aren’t exactly forthcoming about the topic. So researchers have to do a bit of guesswork to come up with some numbers.
A recent article in MIT Technology Review by James O’Donnell and Casey Crownhart is one of the latest efforts to do so. Unusually, the authors start from the query level and work upwards to the macro. A simple text query doesn’t make many demands—”about what it takes to ride six feet on an e-bike, or run a microwave for one-tenth of a second,” in O’Donnell and Crownhart’s words. Generating a simple image takes about two to four times that. A reasonably high-definition video five seconds in length requires lots more: the equivalent of “riding 38 miles on an e-bike, or running a microwave for over an hour.”
These numbers add up. The authors offer the example of using AI to launch a charity run, involving querying about how best to fundraise, generating a flyer, and producing a five-second video for posting to Instagram. That would “use about 2.9 kilowatt-hours of electricity—enough to ride over 100 miles on an e-bike (or around 10 miles in the average electric vehicle) or run the microwave for over three and a half hours.” And that’s just one person with one modest task.
At the aggregate level, the sums get enormous. Lawrence Berkeley Laboratory estimated that in 2024, US data centers of all kinds used enough electricity to power Thailand for a year. AI alone accounted for about a quarter to a third of that total—enough to power more than 7.2 million US homes for a year. Before ChatGPT’s launch in November 2022, AI usage was next to nothing.
This AI-driven onset of rapid electricity demand growth follows years of relative flatness. Data centers proliferated, but got more efficient, resulting in little increase in energy demand. That’s changing radically. On current trends, by 2028, AI alone will use enough electricity to power nearly a quarter of US households.
And since the major AI companies are negotiating favorable electricity deals, residential customers may wind up footing a large share of increased construction and generation costs. An investigation by the Virginia legislature reports that residential customers could see their bills rise by as much as $450 a year because of this cost-shifting. Electricity demand in the state, one of the world’s leading data center locations, is likely to double over the next decade because of demand from AI servers. That’s a major change from the previous 15 years, when there was little growth in demand for juice. And while these data centers are hulking and expensive, once constructed, they generate little employment. Building one can generate 1,500 jobs over 12 to 18 months, but after that, a typical facility employs just 50 workers.
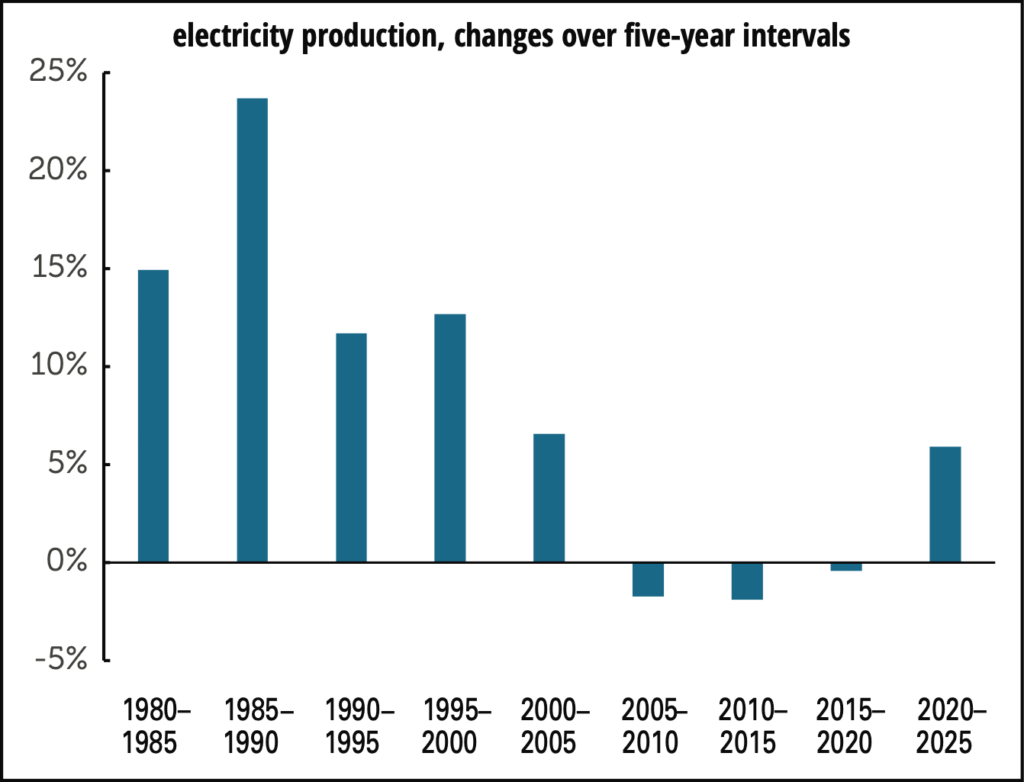
Reflecting on these numbers prompted us to look over some stats on electricity. Nationally, as the graph below shows, electricity production, as measured by the Federal Reserve’s industrial production series, was, like Virginia’s, virtually unchanged between 2006 and 2020—and 2024, for that matter. (We’re using five-year intervals in the graphs because yearly numbers are quite volatile.) It’s begun to rise—up around 2% a year since 2023, compare to an average annual rate of 0.1% between 2000 and 2023, and if the projections are to be believed it’s only the beginning.
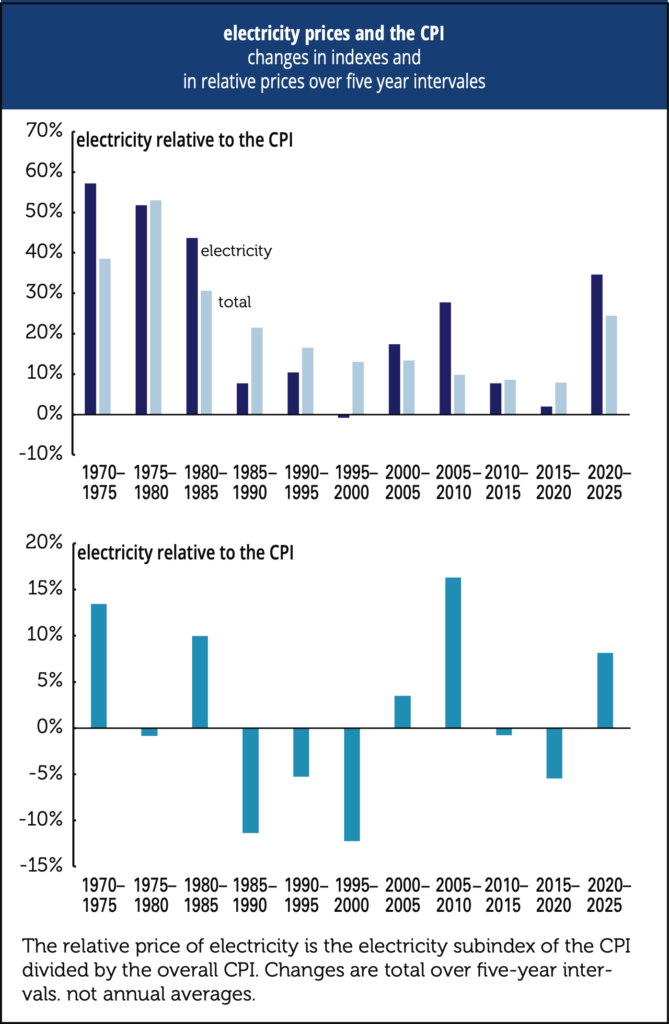
And costs, graph below, are also starting to rise. Measured by the CPI, electricity prices have risen more rapidly over the last five years than at any time since the early 1980s. Electricity prices also surged between 2006 and 2010, driven by sharp increases in natural gas prices, but not by fresh demand. They eased, along with natural gas prices, as the fracking boom kicked in. They’ve been rising again, up over 10% at an annualized rate in late spring and early summer.
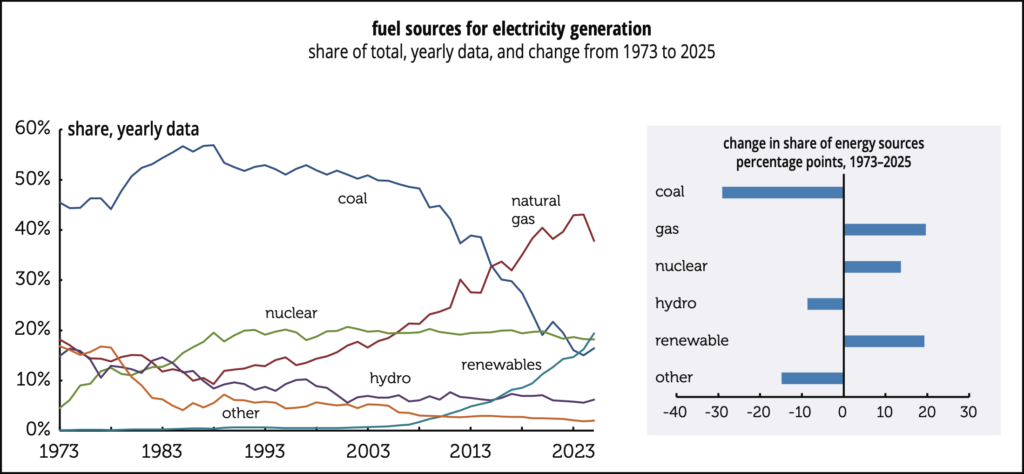
Mention of natural gas brings up the topic of energy sources for electricity generation. These have changed enormously over the last few decades. (Graph below) For much of the 20th century, half or more of our electricity was generated from coal; in 1988, 57% was. From there, coal’s share began a long decline; so far this year, it’s averaged 16%, up a point from last year all-time low. (Coal may be filling some of that AI-increased demand.) Over the same period, natural gas went from 10% to 38%—and renewables (geothermal, solar, wind) went from under 1% to 19% (3 percentage points more than coal).
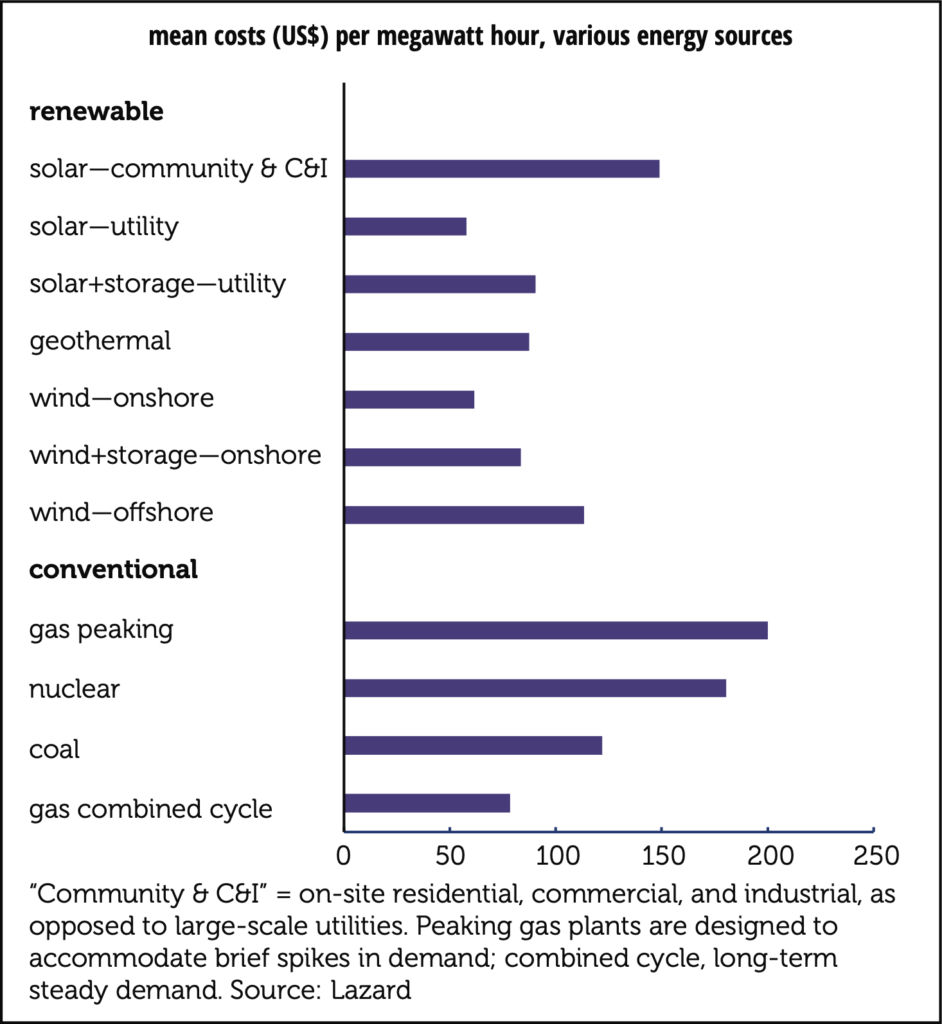
That growth in renewables is driven by cost, not wokeness. Graphed on p. 7 are the costs of various energy sources as estimated by Lazard. (They present ranges; the graph shows the means of those ranges.) Onshore wind installations are 22% cheaper than gas and 50% cheaper than coal. Individual solar facilities on houses and industrial sites aren’t so cheap, but large-scale installations managed by utilities are 26% cheaper than gas-fired generating facilities and 52% cheaper than coal.
These are not transient developments. In the 2020 edition of its World Energy Outlook the International Energy Agency (IEA) said that solar power “is now the cheapest source of electricity in history.” Wind’s advantage isn’t as dramatic, but it’s real—and utilities are acting on these cost comparisons. Again, according to the IEA, this its Global Energy Review 2025 (which has replaced the World Energy Outlook), renewables “made up almost three-quarters of the overall increase in power generation” in 2024, with solar in the lead. Add nuclear and hydro and you approach four-fifths. Fossil fuels accounted for almost all of the remaining fifth, well below their existing share.
Fossil fuels are on the way out. Over the longer term, the IEA projects that global oil demand growth will slow into a peak in 2030, and begin declining thereafter, and what increase in demand there is likely to be will be for petrochemicals, not energy. (Projections like these have led the Trump administration to threaten to withdraw from the IEA.) Natural gas is another story—demand for it, according to McKinsey, is projected to grow over the next decade, the only fossil fuel to do so after 2030, to a peak around 2037 and then flatline thereafter. While policies could accelerate or retard the post-fossil transition, the relative costs of the energy sources are doing much of the transformative work.
Sadly, US policy is paddling against this current. As we were writing this, news came in that the Trump administration was intensifying its previously declared war on windmills, assembling a joint task force staffed by six cabinet agencies to put an end to what the president sees as an ugly (tastes differ) and expensive (it’s not) energy source. (He also hates solar, but he’s carrying on that war with less intensity for now.) Instead, his administration is encouraging utilities to turn to more expensive options like gas and coal. Even if you’re a skeptic on climate change, this emphasis makes little economic sense.
 More Info...
Subscribe >
More Info...
Subscribe >
 More Info...
Subscribe >
More Info...
Subscribe >
AI Energy Demands: E-bike feet, miles, the country of Thailand?
AI is making enormous demands on electricity grids around the world. Exactly how enormous isn’t easy to say, since statistical agencies aren’t reporting the AI sector separately and the companies themselves aren’t exactly forthcoming about the topic. So researchers have to do a bit of guesswork to come up with some numbers.
A recent article in MIT Technology Review by James O’Donnell and Casey Crownhart is one of the latest efforts to do so. Unusually, the authors start from the query level and work upwards to the macro. A simple text query doesn’t make many demands—”about what it takes to ride six feet on an e-bike, or run a microwave for one-tenth of a second,” in O’Donnell and Crownhart’s words. Generating a simple image takes about two to four times that. A reasonably high-definition video five seconds in length requires lots more: the equivalent of “riding 38 miles on an e-bike, or running a microwave for over an hour.”
These numbers add up. The authors offer the example of using AI to launch a charity run, involving querying about how best to fundraise, generating a flyer, and producing a five-second video for posting to Instagram. That would “use about 2.9 kilowatt-hours of electricity—enough to ride over 100 miles on an e-bike (or around 10 miles in the average electric vehicle) or run the microwave for over three and a half hours.” And that’s just one person with one modest task.
At the aggregate level, the sums get enormous. Lawrence Berkeley Laboratory estimated that in 2024, US data centers of all kinds used enough electricity to power Thailand for a year. AI alone accounted for about a quarter to a third of that total—enough to power more than 7.2 million US homes for a year. Before ChatGPT’s launch in November 2022, AI usage was next to nothing.
This AI-driven onset of rapid electricity demand growth follows years of relative flatness. Data centers proliferated, but got more efficient, resulting in little increase in energy demand. That’s changing radically. On current trends, by 2028, AI alone will use enough electricity to power nearly a quarter of US households.
And since the major AI companies are negotiating favorable electricity deals, residential customers may wind up footing a large share of increased construction and generation costs. An investigation by the Virginia legislature reports that residential customers could see their bills rise by as much as $450 a year because of this cost-shifting. Electricity demand in the state, one of the world’s leading data center locations, is likely to double over the next decade because of demand from AI servers. That’s a major change from the previous 15 years, when there was little growth in demand for juice. And while these data centers are hulking and expensive, once constructed, they generate little employment. Building one can generate 1,500 jobs over 12 to 18 months, but after that, a typical facility employs just 50 workers.
Reflecting on these numbers prompted us to look over some stats on electricity. Nationally, as the graph below shows, electricity production, as measured by the Federal Reserve’s industrial production series, was, like Virginia’s, virtually unchanged between 2006 and 2020—and 2024, for that matter. (We’re using five-year intervals in the graphs because yearly numbers are quite volatile.) It’s begun to rise—up around 2% a year since 2023, compare to an average annual rate of 0.1% between 2000 and 2023, and if the projections are to be believed it’s only the beginning.
And costs, graph below, are also starting to rise. Measured by the CPI, electricity prices have risen more rapidly over the last five years than at any time since the early 1980s. Electricity prices also surged between 2006 and 2010, driven by sharp increases in natural gas prices, but not by fresh demand. They eased, along with natural gas prices, as the fracking boom kicked in. They’ve been rising again, up over 10% at an annualized rate in late spring and early summer.
Mention of natural gas brings up the topic of energy sources for electricity generation. These have changed enormously over the last few decades. (Graph below) For much of the 20th century, half or more of our electricity was generated from coal; in 1988, 57% was. From there, coal’s share began a long decline; so far this year, it’s averaged 16%, up a point from last year all-time low. (Coal may be filling some of that AI-increased demand.) Over the same period, natural gas went from 10% to 38%—and renewables (geothermal, solar, wind) went from under 1% to 19% (3 percentage points more than coal).
That growth in renewables is driven by cost, not wokeness. Graphed on p. 7 are the costs of various energy sources as estimated by Lazard. (They present ranges; the graph shows the means of those ranges.) Onshore wind installations are 22% cheaper than gas and 50% cheaper than coal. Individual solar facilities on houses and industrial sites aren’t so cheap, but large-scale installations managed by utilities are 26% cheaper than gas-fired generating facilities and 52% cheaper than coal.
These are not transient developments. In the 2020 edition of its World Energy Outlook the International Energy Agency (IEA) said that solar power “is now the cheapest source of electricity in history.” Wind’s advantage isn’t as dramatic, but it’s real—and utilities are acting on these cost comparisons. Again, according to the IEA, this its Global Energy Review 2025 (which has replaced the World Energy Outlook), renewables “made up almost three-quarters of the overall increase in power generation” in 2024, with solar in the lead. Add nuclear and hydro and you approach four-fifths. Fossil fuels accounted for almost all of the remaining fifth, well below their existing share.
Fossil fuels are on the way out. Over the longer term, the IEA projects that global oil demand growth will slow into a peak in 2030, and begin declining thereafter, and what increase in demand there is likely to be will be for petrochemicals, not energy. (Projections like these have led the Trump administration to threaten to withdraw from the IEA.) Natural gas is another story—demand for it, according to McKinsey, is projected to grow over the next decade, the only fossil fuel to do so after 2030, to a peak around 2037 and then flatline thereafter. While policies could accelerate or retard the post-fossil transition, the relative costs of the energy sources are doing much of the transformative work.
Sadly, US policy is paddling against this current. As we were writing this, news came in that the Trump administration was intensifying its previously declared war on windmills, assembling a joint task force staffed by six cabinet agencies to put an end to what the president sees as an ugly (tastes differ) and expensive (it’s not) energy source. (He also hates solar, but he’s carrying on that war with less intensity for now.) Instead, his administration is encouraging utilities to turn to more expensive options like gas and coal. Even if you’re a skeptic on climate change, this emphasis makes little economic sense.