Red Flags

A Metaphor Unlikely to Deliver: Betting on H20

Michael Hiltzik has a piece buried in this morning’s Los Angeles Times, with the catchy title, “Wall Street Can Now Bet on the Price of California Water: Watch Out,” but more staid content.

Amid questions about how such an index would work “anywhere outside California,” he mentions that people who have tried to make money from California water rates have often lost their shirts. In one such plot, Texas’s Bass brothers fell far short of their goal of $92 million in revenue in the first year when they bought farmland in California’s Imperial Valley, which entitled them to buy water at a federally subsidized $12.50 an acre-foot. The plan was to let the land lie fallow and sell the water to thirsty San Diego at $400.00 an acre-foot. Not so said the Metro Water District amid public uproar, and the Bass brothers sold off the land, making a profit, but.

Those who put together the index claim it’s “doing good,” and Hiltzik says they are correct on the locking in of prices for farmers, “as far as it goes.”

To him, the problem is not the speculation, it’s that an index can’t address the underlying causes of water scarcity, including climate change and wasteful agricultural practices, which are expected to deteriorate further.

Another problem we’re underscoring—it probably won’t make headlines—is a potential hit to our beleaguered, bottom-line essential agricultural workers. Hiltzik suggests that using markets to try to manage things like water shortages excludes certain affected players who can’t participate, in this case, the environment, and farmworkers. If farmers are in the position where they are better leaving their fields fallow and selling their water, the farmworker is “out of luck.” And a job.

Ellen Hanak, water expert at the Public Policy Institute of California who pointed out the missing shirts above, also cautioned that water is a “heavy commodity with a lot of restrictions on how it can be moved… People talk about water as the new gold, but that’s just a metaphor.”

Cormorants on Malibu Lagoon

by admin· · 0 comments · Red Flags

Consumer Credit: Demand & Availability Take a Hit

Consumer credit demand and availability took a sharp hit in recent months, according to the New York Fed’s latest Credit Access Survey. The hit was sharpest in credit cards, followed by auto loans. Mortgage refinancing, especially for creditworthy borrowers, was an exception to the trend.

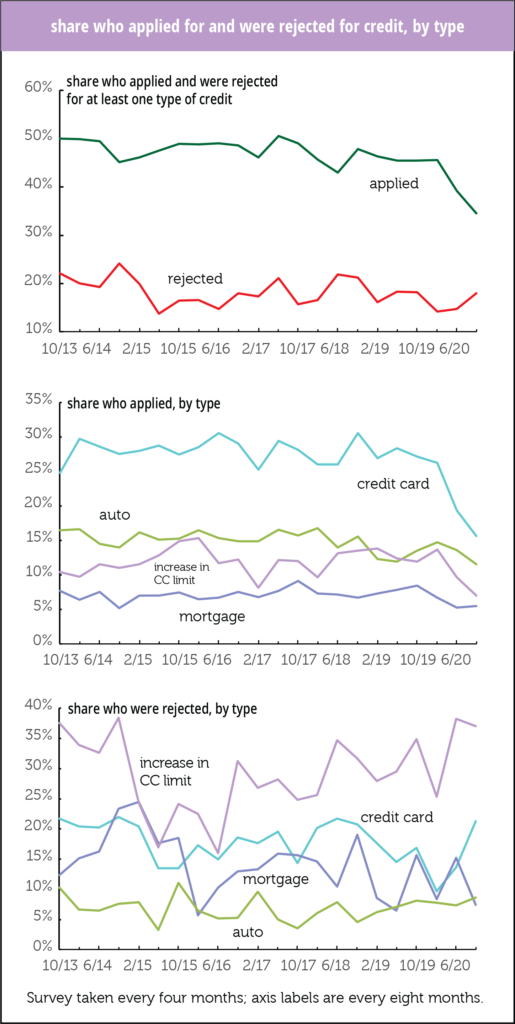
In the four months ending in October, just 35% of surveyed consumers applied for one or more types of credit, down from 39% in the four months ending in June, and the 46% average for 2018–2019. The pullback was broad-based across age and credit score groups. Despite the decline in applications, the rejection rate for at least one type of credit rose from 15% to 18%, though that 18% is little different from the 19% average of 2018–2019. (See first graph below.) Rejections were highest for applicants with credit scores below 680. As the New York Fed points out in its write-up of the findings, these results are consistent with the Fed’s latest loan officer survey, which showed a tightening of lending standards on consumer credit.

The pullback in applications and rise in rejections was sharpest in credit cards, both for new applications and raising of existing limits. (Second and third graphs below.) Just 16% of respondents applied for a new credit card, down from 19% in the previous period, and the lowest since the series began in 2013. Application for higher credit lines fell from 10% to 7%, a series low, and just over half the series average of 12%. A substantial 37% of the applications were rejected, down from the previous period’s 38%, the series high. Applications for mortgages were steady at 5%, tying the low for the series—though rejections were also at a low.. Just 12% of respondents applied for an auto loan, tying the series low, and 9% were rejected, at the high end of the series’ historical range.

Not graphed, to avoid visual overcrowding: applications for mortgage refinancing. Those rose to 16% of households in October, its highest level in seven years. The 6-point rise from February was driven by consumers with credit scores above 760.

Consumers mostly expect credit card availability to remain tight, especially among those with low credit scores. Expectations of availability for other kinds of credit are within historical norms, however.

Households are concerned about meeting unexpected expenses. Just two-thirds, 66%, of households thought they could come up with $2,000 in a pinch, a series low, and down from 70% in 2019.

Tight credit card conditions will probably be a drag on spending in the coming months, especially if the job market recovery continues to cool. But housing finance looks secure for now, especially for high-end borrowers.

by admin· · 0 comments · Red Flags

Benchmark Blues: BLS to Cut 0.3%, or 501,000 jobs, from 2019 levels

The extrapolation methods used by the Bureau of Labor Statistics in producing their monthly estimates (their word) of NonFarm Payroll (NFP) growth can obscure the magnitude of cycle turns, which is why it is important to pay attention to the annual benchmark, derived from the Unemployment Insurance filings mandated by federal law that cover 97% of the NFP universe.

The rule of thumb at the BLS is that if the benchmark falls between +/-0.2%, the average of the last 10 years, everything is copacetic, but if it exceeds that there is real information there. This morning the BLS released the preliminary benchmark for 2019 and, unfortunately, there is information there. The overall employment level is slated to be taken down by -0.3% or 501,000 jobs when it is made formal in January 2020, and in the private sector -0.4%, or -514,000 of the jobs previously estimated will be benchmarked away.

Largest losses are in logging & mining, -2.2%, or a scant -16,000 jobs, leisure & hospitality -1.1%, a not-so scant -175,000 jobs, retail trade -0.9%, or -146,400 jobs, professional/business services, -0.8%, or -163,000 jobs, and wholesale trade, -0.6%. Transportation & warehousing will be revised up 1.4%, or about 80,000 jobs, information 1.2% or 33,000 jobs, and government 0.1%, or 13,000 jobs. That’s it for the plus signs.

As you can see on the table, this is both out of trend, and the largest negative benchmark since the 2010 decline in the aftermath of the great recession.

“Credit positive activities,” A Short-lived Phenomenon

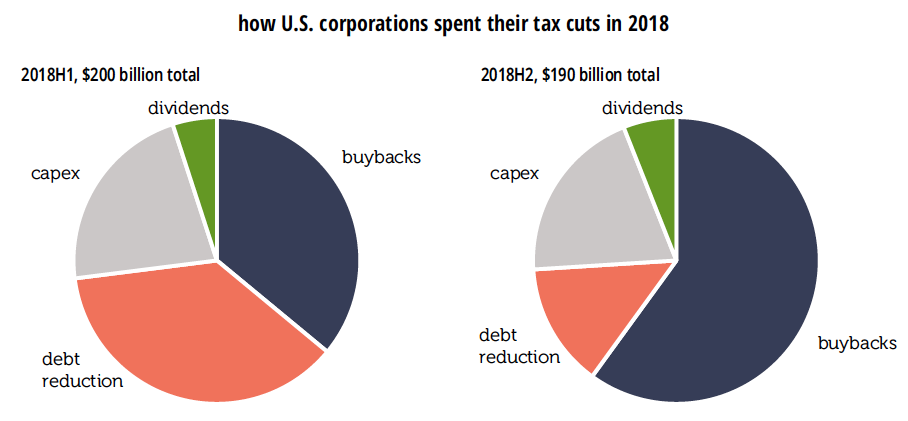
According to a Moody’s analysis of 100 large companies, after an initial round of “credit positive activities,” notably debt reduction, following the corporate tax cuts in the 2017 overhaul, firms have shifted their attention to stock buybacks. The tax cuts increased corporate cash flow by almost $400 billion in 2018. Of that increment, 37% went to debt reduction in the first half; that fell to 14% in the second half. Just over a third, or 36% went to share repurchases in the first half; in the second half, that soared to 60%. Capital spending’s share went from 22% in H1 to 20% in H2.

The first half’s gross debt paydown exceeded gross borrowing, making for a net reduction in debt outstanding. In the second half, however, firms returned to net borrowing (though at a rate considerably below 2016 and 2017).

Shifting the focus from the uses of the tax cut gusher alone, firms devoted 49% of their total cash outflow to capex in 2016–2017; that fell to 41% in 2018. But the share devoted to buybacks went from 25% to 31%.

Moody’s report pairs nicely with a new NBER working paper by Daniel Greenwald of MIT, Martin Lettau of Berkeley, and Sydney Ludvigson of NYU, “How the Wealth Was Won: Factors Shares as Market Fundamentals.” They find that between 1989 and 2017, $23 trillion in real equity wealth was created by the nonfinancial corporate sector. More than half, 54%, of that increase “was attributable to a reallocation of rents to shareholders in a decelerating economy.” (To be specific, those rents were reallocated away from labor.) Economic growth accounted for 24% of those gains, lower interest rates for 11%, and a lower risk premium, also for 11%. By contrast, between 1952 and 1988, less than half as much wealth was created, but almost all of it, 92%, can be attributed to economic growth. Conventional estimates of the equity risk premium are, by their work, overstated by 50%.

Unlike many models of stock returns, rather than imagining a single representative agent, Greenwald et al. divide the population into shareholders and workers—in line with a world where the top 5% of stock wealth distribution owns 76% of total stock market value. Shareholders earn relatively little of their income from labor, and workers earn almost all of theirs that way. In this model, shifts in income from labor to capital, which play no role in the traditional valuation literature, have a significant explanatory power over stock market returns. A reminder that two of the three authors of the paper are business school professors and not freelancing Bolsheviks.

What about the low interest rates of recent years? The authors find they explain little of the stock market’s rise since the financial crisis. While real rates are low by the standards of the 1984–2000 period, they’re not by the standards of the 1950s through the 1970s.

Greenwald et al. do not address buybacks specifically, but they certainly fit in with the distributional shift towards shareholders in their model.

Philippa Dunne & Doug Henwood

by admin· · 0 comments · Red Flags

IPOs Underperforming the Broad Market

The unicorns are finally going public in size after a long delay. Lyft did its IPO at the end of March, and Uber will be coming any day now. And more as the year goes on, flooding the San Francisco Bay Area with billions, and separating techno-optimists from large quantities money. It’s almost like 1999 again, minus the productivity acceleration (and pervasive euphoria).

Perhaps we’re being spoilsports, but this is all looking rather frothy. We’ve been worrying for some time about stock market high valuations, but an exuberance has been missing. Wacky IPOs might be a sign that the long bull market is finally entering its blowoff phase (though these can take some time).

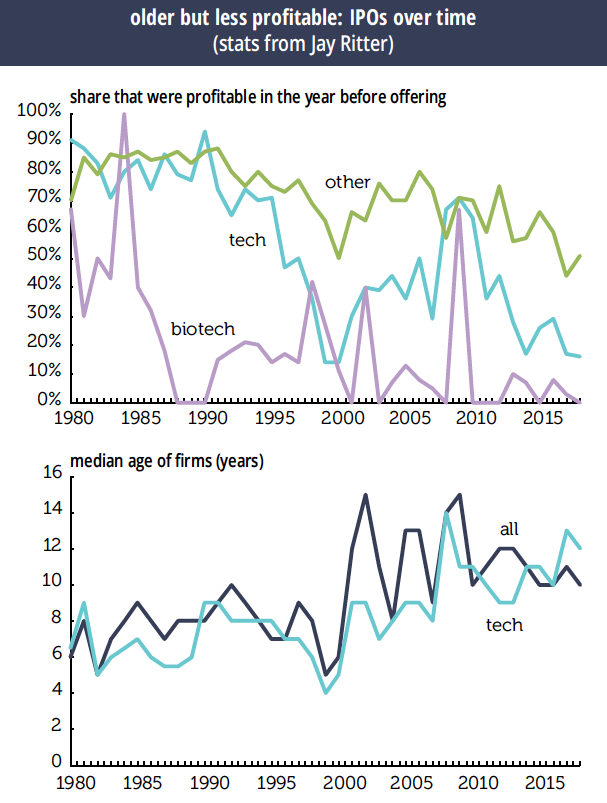
Here are some stats from the leading academic authority on IPOs, Jay Ritter of the University of Florida. As the top graph below shows, there’s been a long-term decline in the share of firms making their market debut that were profitable. In the 1980s, 81% of tech firms going public were profitable; that fell to 14% in 1999–2000 but rose back to 38% from 2001–2007 (though obviously many fewer floated stock in the early 2000s than the late 1990s). But we got back to 16% in 2018. The profitable share of firms classed as “other” has almost always been higher, but it follows a similar path. Biotech firms are the least profitable, but they’re often swinging for the fences with a single product rather than trying to build a broad business.

As the lower graph shows, today’s market debutantes are generally much older than those of the dot.com era—an average of twelve years in 2018 compared to less than eight at the end of the 1990s. Uber, which lost $3 billion on revenues of $11 billion last year, and which shows no signs of becoming profitable any time soon, is ten years old. (As the company confesses in its prospectus, “we may not be able to achieve or maintain profitability in the near term or at all.”) You might think a firm that’s not making money after a decade or more of life and survives only on constant infusions of cash from venture capitalists might not have the best prospects for the future. But, as conceded above, perhaps we’re being spoilsports.

But maybe not. Ritter shows that since 1980, using a three-year buy-and-hold strategy, IPOs have underperformed the broad market by over 18 percentage points. Which makes one want to ask a VC, if this firm is such a great investment, why are you selling it?

by admin· · 0 comments · Red Flags