Employment & Productivity

CBO: US economy, less potential than ever

For better or worse, Congressional Budget Office (CBO) is the the go-to authority on budget projections. They are planning to update to their economic and budget projections in a couple of weeks, and we thought it would be interesting to look back on some of the CBO’s past projections. The results of that exercise make us want to say “for better or worse indeed.” And one more endorsement of the CBO official who expressed his opinion in 2007 that forecasting out more than a year or two is a waste of taxpayers’ money.

Just as we write when we’ve review the Fed’s economic projections, we don’t want to make fun of them: economic forecasting is a treacherous business. No doubt prudence demands that what is sometimes called “the forecasting community” give it the old college try, but one should regard the results with considerable skepticism.

The graph below shows several vintages of CBO ten-year projections for the major federal budget components compared with the actual history. We chose January 2007, because it was about a year ahead of the business cycle peak; January 2010, because that’s when we were crawling out of the Great Recession; and March 2016, because that’s the most recent exercise. The CBO was wildly optimistic about revenues in 2007, and surprisingly so again in 2010. It’s now projecting revenues will be essentially flat as a share of GDP for the next ten years. Given the trajectory of the “actual” line, that flatness seems unlikely, though of course that was an unusually volatile period.

Budget

The outlay projections are also quite off-target—way too low in 2007, and way too high in 2010, almost as if the stimulus program would go on forever. The CBO is now forecasting a sustained rise of about 3 percentage points of GDP in outlays over the next decade—but the 2026 endpoint is below where it thought the 2020 level would be in 2010. And all are above the neighborhood it was thinking about in 2007.

As for the number the bond market is most interested in, the deficit, those projections aren’t so great either. For some reason, in 2007, the CBO thought the budget would soon be running in the black; it projected a surplus of 1.0% of GDP in 2012 compared with an actual deficit of 6.8%. It got the direction of change basically right in 2010 (despite having gotten the revenue and outlay projections rather badly wrong), though it got a little ahead of what reality would turn out to be. It’s now forecasting a gradual increase in the deficit over the next ten years. That is the standard wisdom, but given this track record, should we believe it?

And now on to a more arcane topic, potential GDP, which is of interest mainly to economists and central bankers. In theory, when actual GDP exceeds potential, inflationary pressures mount; when it’s below potential, there’s room for accelerating growth.

But as the next graph shows, the estimates of potential are quite unstable. In 2002, the CBO was estimating a potential growth rate of just over 3%, after recovery from the 2001 recession. Despite that recovery, which exceeded 3% from 2003–2005, the CBO marked down its estimates of potential growth to the 2.7–2.8% range, even for some of the period before the estimate. Reality outdid these greatly diminished expectations by contracting sharply in 2008 and 2009. But now the CBO sees the U.S. economy has having less potential than ever; it sees the growth in potential as 1.6% now (not that reality is outdoing that by much) and rising to all of 2.0% over the next decade.

potential

Should one actually make monetary or fiscal policy based on such projections? The glum 2016 projection is a function of slow labor force growth and weak productivity—but should we accept those, especially productivity, as the best we can do? Or should we instead be trying to figure out how to raise them?

by admin· · 0 comments · Employment & Productivity

Cinching the Propensity to Depart

In a new piece of the wage and job-churn puzzle, the Treasury Department recently published a report on the widespread use of non-competition agreements around the country.

Non-competition agreements, which surely our readers are familiar with (!), are intended to encourage businesses to invest in their workers by reducing the likelihood that the worker will move elsewhere, and to encourage inovation by protecting trade secrets, a trickier argument to make since such secrets are often protected by other law.

The Treasury Department, however, is looking into detrimental effects on worker mobility, and hence wage growth, innovation, and new business formation. Although media headlines glommed onto doggie day care workers laboring under such agreements (which is either laughable or outrageous, take your pick), the Treasury lists fast-food employees, warehouse workers, and camp counselors as other signers, and wonders where the social value lies in asking an entry-level low-wage burger flipper to sign a two-year non-compete. There is a lot of important stuff in the Treasury and other reports tied to free markets, innovation and “perfect information,” all crucial aspects of a vibrant economy but perhaps currently straitened by onerous legalities.

It’s a complicated subject: not all states enforce such agreements, some are overly broad and hence get thrown out of court, in some states employers can revise agreements after the fact to make them enforceable, in others they can’t. One study found that, as of 2015, non-competes were enforceable in about half of the states even in cases where the employee was fired without cause. Some researchers speculate these agreements allow companies to hire, preferentially, workers with a lower propensity to depart, especially since such workers could not convincingly make that case on their own, except by a willingness to accept such a restriction, which would be less of a burden to them. On and on.

Understanding has a big role in this as well. Many workers—and we’ve heard this from some high-level strategists in the financial sector—don’t fully understand what they are signing, and the preferential hiring argument rests on just such an understanding, probably a weak link. For example, California has among the highest percentages, 22%, of such contracts, but noncompetes are generally not enforced at the state level there, so employers are relying on workers’ lack of knowledge about the legal system.

On to a barrage of percentages: Nationally, 19% of our workers are currently restricted by such agreements, and close to 40% have signed them in their working lives.

Although there are questions about the overall benefits even for math and computer specialists, such limitations make the most sense in such fields and, indeed, about one-third of high-tech and math workers have signed non-competes. On the other end of the spectrum, about 14% of workers who are either making less than $40,000 a year, and/or do not have college educations are also clenched by such agreements.

Ten percent of workers reported bargaining on their non-competes, and 38% of the non-bargainers did not know they could do such a thing. In many cases such agreements are proffered after the employee has accepted the position, as in turned down all other offers. Treasury estimates that the lower bound on this after-the-acceptance practice—a new use for a tired term—is 37%. In one study 70% of highly skilled electrical workers were asked to sign such agreements after they had accepted offers, half of the time after the first day of work, another affront to perfect knowledge. The Treasury report points out that this kind of tactic need not be used if the agreements truly were beneficial to both parties.

Only 24% of all workers report having trade secrets in their possession, and these workers, as well as those who interact with clients, are understandably more likely to have signed non-competes. But less than half of all workers who have signed noncompetes meet these standards, which “suggests” to the Treasury that protecting trade-secrets “does not explain the majority of these contracts.”

And related litigation is on the rise: A 2013 study commissioned by the Wall Street Journal showed either a rise in the prevalence of non-competes, or perhaps a “significant” increase in their enforcement, and law firm Beck Reed Ridden  ferreted out a 61% increase in the number of employees getting sued under these agreements between 2003 and 2013.

On the legislative side, recently Oregon limited such agreements to 18 months, and Hawaii prohibited them for all tech workers, which Missouri legislators proposed but were unable to pass. Maryland and New Jersey are working to make non-competes unenforceable if a worker is eligible for unemployment insurance benefits, with Massachusetts, Michigan and Washington proposing to make them generally unenforceable. Proposals in Minnesota and Connecticut would bar such agreements for workers making less than $15.00 an hour, while Georgia recently amended its constitution, no less, to allow for greater enforcement.

How goes it around the world?

Law protecting free trade generally makes such agreements unenforceable in India. In the UK an employer must demonstrate what is being protected; “competition”itself doesn’t make the grade. Many countries impose more limited tenure on such agreements, and many require those sidelined to be paid a portion of their former salary, a quarter in Romania, a third in France, and half in Germany and Belgian, for example.

Why does this matter?

Wages: Non-competes erode bargaining power, and have an adverse effect on wage growth. We grabbed the graph below from the Treasury piece comparing wages, reweighted by occupation, in states with heavy and no enforcement.

Age-wage profile

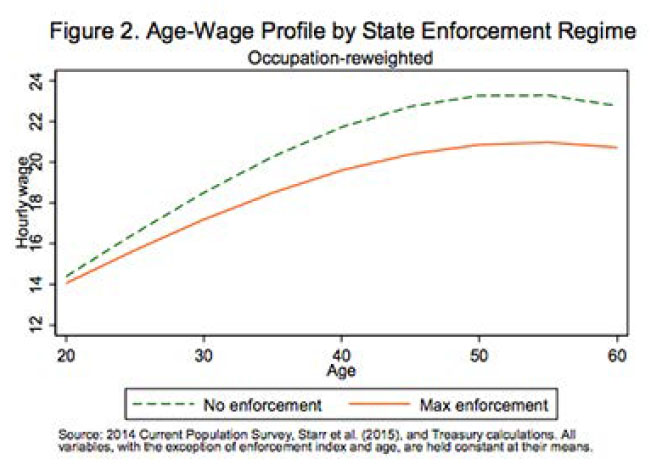
Of course, it’s not a slam-dunk: Median household incomes in California rank third in the nation, and are about 150% of 33rd ranked Georgia’s median household incomes. Clearly there is more at play there than California’s lack of enforcement and Georgia’s more aggressive stance.

Innovation and productivity: We know that high-tech firms often cluster in regions with competitive suppliers, large numbers of qualified workers, and “information spillovers” among firms. Of course, such spillovers are not always beneficial to firms whose ideas are on the move, although they will rotate into the taking position again. But spillover is one of the drivers of innovation, job churn and productivity and so is beneficial to regional economies on the whole.

Some studies referenced within the Treasury piece note that workers tend to migrate to states were enforcement is weakest, hence contributing to brain drain of specific regions.

In their paper “Do strict trade secret and non-competition laws obstruct innovation?” (not free online) two specialists, Charles T. Graves and James A. DiBoise argue that, whatever we have come to believe about protecting intellectual property, the real innovators are the creative job-hopping employees themselves, and anything that restricts their mobility impedes the advancement of valuable “destructive” technologies. They suggest reform would be a good thing, and they have something to lose in suggesting this: they both represent employees in noncompete litigation.

Harvard law professor William W. Fisher working with Felix Oberholzer-Ghee of the Business School in their paper on developing an integrated approach to managing intellectual property make the point that although intellectual property rights represent a “significant fraction” of enterprise value, recent surveys show that less than half of current business leaders understand how important such rights are, or are actively involved in strategic planning. They note that IP management is handed off to legal departments who are little involved in strategic planning, and strategic managers don’t work together.

This double-silo approach leads to short-sighted solutions, most lamentably legally driven attempts to leverage their IP possibilities in a way that derail important network effects, and “worse yet, enable competitors to capitalize on network effects.”

We often argue that R&D spending is below where it should be. Efforts to control employee movement read as a dinosaur in the vibrant high-tech world, and such squabbling suggests too much attention to the fencing, and not enough to the care of the herd.

We’ll end with this wise advice from the irascible HR Examiner:: “Your Trade Secrets are Secret For About 27 Days. Or 27 minutes. Really, the secret way of doing almost anything is over… Why are you focused on the rear-view mirror and trying to protect something that will be obsolete long before the lawsuit is over?”

by admin· · 0 comments · Employment & Productivity

What are transportation fuels telling us?

We follow transportation fuel sales volumes because they have a tight relationship with overall and manufacturing employment. The data are released with a lag, but they still provide a lead on the health of employment, especially manufacturing employment.

There’s been quite a bit of price action in the sector. Since bottoming out at $26.19 per barrel (bbl) on February 11th, the WTI price of crude has recovered to near $50; since mid-February the average price of regular gasoline has risen from $1.64 to $2.24 per gallon and the average price of diesel has increased from $1.98 to $2.36 per gallon.

Since the end of April, the nation’s crude oil inventory has decreased by almost 3 million bbls, or 0.1%. Domestic production has decreased by 11.5% since peaking during March 2015, shale oil production has decreased by 8.4% its March 2015 peak.

During December 2015 (most current data), diesel fuel sales increased by 82.5 million gallons (2.3%) nationwide over the year. During the prior 3-, 6-, and 12-months, increases were 2.5%, 3.1%, and 2.5%. This brought the 1-month diffusion index below 50 for the first time since May 2015, or from 52.9 to 47.1, as shown in this graph:

Diffusion

This next chart shows that the strongest diesel sales growth occurred in the Southeast, Great Lakes and Rocky Mountain regions during the past three months, while sales fell in the Southwest, Plains and Mideast regions.

Diesel yy

The 3-month-average growth rate for diesel sales bounced back from November’s 1.81% to 2.49% in December. During April, the relevant month, total employment growth rate decreased from 1.99% to 1.88%. The growth rate for manufacturing employment moved up from -0.20% to -0.16%, and remains near the lowest level since September 2010. Although other indicators imply some positive signs for growth in the manufacturing sector, diesel fuel sells imply growth in this sector will remain subdued through much of the remainder of 2016:

Employ diesel

by admin· · 0 comments · Employment & Productivity

Counterfactual Failure Alert!

5d0320d4-f194-468f-927a-0ea2798f35e3We’ve been focusing on productivity in recent issues and had some questions concerning possible measurement of high-tech productivity from some readers in the last weeks. Wouldn’t that be nice, but, alas, two new studies dim such hopes.

The two papers make many of the same points. All agree that there is a measurement problem, but that it was likely larger during the high growth period of 1995 to 2004 than it is today. In “Does the United States have a productivity slowdown or a measurement problem?” authors David M. Byrne, John G Fernald, and Marshall B. Reinsdorf suggest some adjustments to IT-related sectors, which make recent growth in investment and GDP look a bit better, and adjustments to durable goods manufacturing, which make labor productivity look even worse.

In his “challenge to mismeasurement explanations,” University of Chicago professor Chad Syverson argues that the highest estimate of the surplus generated by internet-linked technologies is only one-third of the “purportedly mismeasured GDP,” even using his “very expansive assumptions about the value of leisure time.” Equally bad, to account for even a modest piece of the $2.7 trillion hole left by the productivity slow-down, output and productivity in information and communications technologies (ICT) would have to be multiples of what is currently reported. For example, combined employment in computer/electronic manufacturing, information, and computer systems design rose 3.6%, from 5.58 million to 5.78 million, between 2004 and 2015. If those workers actually did produce the output lost to the productivity slowdown, real value added per worker would have risen an “astounding” 363% over those years, far outpacing the 83% growth in durable goods manufacturing between 1995 and 2004.

Syverson throws cold water on the argument that Gross Domestic Income being slightly higher than Gross Domestic Product since 2004 suggests that people are being paid to make things that are sold at heavy discounts: that disparity is based on “unusually high” capital income [read profits], not labor income. He points out that if the annualized 1.5% drop in labor productivity were to persist over the next 25 years it would compound to a 45% decrease in per capita income.

Byrne et al. argue that since domestic production of IT hardware has decreased, the effect of mismeasurement was likely larger before the as-measured slowdown after 2004. They also make the point that consumer benefits from Google searches and fun on Facebook are non-market (akin to playing soccer with one’s children), and anyway are too small to compensate for the loss in “overall wellbeing” driven by slower market-sector productivity growth. They see real improvement in matching products and services with consumers, but nest these in a continuum of changes that once included the shift in responsibility for doing the laundry from a domestic washer-person, to a family-member, and finally to a washing machine.

They point the finger at the decline in economic dynamism including the dearth of start-ups and slower reallocation of resources following productivity shocks, and note the possibility that the fast-growth period between 1995 and 2004 might be the anomaly. And they admit they don’t know what gains will come from cloud computing, and that more IT-driven increases may be in the offing.

The productivity showdown is widespread, and Syverson matches OECD labor productivity data with ICT intensity, which he measure as access to broadband, for close to 30 countries. He regresses labor productivity with broadband penetration for a -0.001 co-efficient, a point estimate that implies that one standard deviation (SD) in broadband penetration comes with one-fiftieth of a SD in the magnitude of the slowdown. This coincides with work showing that differences in the slowdown in total factor productivity in U.S. states are not correlated with each state’s ICT intensity.

Syverson writes that the “intuitive and plausible empirical case for the mismeasurement hypothesis faces a higher bar in the data,” and that the slowdown is real. In closing he notes that whether the slowdown will end “anytime soon is an open question.” We’re not seeing it yet, so that’s a question we have to address.

by admin· · 0 comments · Employment & Productivity

Federal Reserve’s LMCI Weakens Further

Recently we’ve been writing about the three-consecutive-month decline in the Fed’s Labor Market Conditions Index (LMCI), which is updated on the Monday after the employment report. The sluggish April report caused the LMCI to decline further, making it a four-month streak. The decline may not look like much on the graph on p. 7, but four-month running declines are rare outside recessions or the months immediately preceding them. There were such streaks during the “mid-cycle slowdowns” of 1985–1986 and 1995–1996, but those followed periods of Federal Reserve tightening. Otherwise, none.

LMCI

We suppose you could call the end of QE and the upward nudge in fed funds a tightening, but the central bank remains extraordinarily indulgent with little immediate prospect of a hostile turn. So count us slightly more troubled than we were the time time we wrote about this.