This is a dense post but there is a lot of data here and it’s worth knowing.
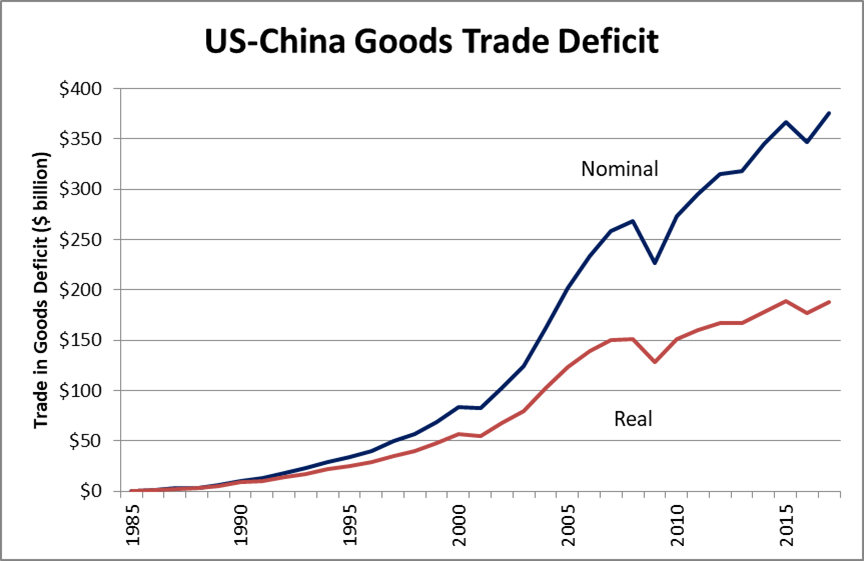
President Trump in his trade war with China has fixated narrowly on the U.S. – China imbalance between the export and import of goods between the two nations. The Census Bureau maintains a trade in goods by country dataset that includes import and export amounts in nominal dollars back to 1985. The chart below shows the trade in goods deficit with China from 1985 through 2017 in both nominal (blue) and real (red) dollars.
In 1985 the goods trade between the United States and China was about equal. By 2000, the nominal trade in goods deficit grew to $83.3 billion. From 1985 to 2000, U.S. goods exports to China rose from $3.9 billion to $16.2 billion, or by $12.3 billion (319.8%). Over the same period, U.S. goods imports from China increased from $3.9 billion to $100.0 billion, or by $96.1 billion (2,490.0%).
As large as the increase in Chinese exports to the United States was from 1985 to 2000, that growth has been eclipsed by the growth since 2001, when China was admitted to the World Trade Organization (WTO). From 2001 through 2017 Chinese goods exported to the United States jumped from $102.3 billion to $505.5 billion, or by $403.2 billion (394.2%). Over the same years U.S. goods exports to China grew from $19.2 billion to $129.9 billion, or by $110.7 billion (577.2%).
Over the entire period from 1985 through 2017 nominal goods exports from the U.S. to China grew by $126.0 billion (3,268.9%). Goods imports from China over this period grew by $501.6 billion (12,989.3%). The nominal value of the trade in goods deficit rose from $6.0 million in 1985 to $375.6 billion in 2017. Adjusted for inflation the trade in goods deficit in 2017 (in $1985) equaled $188.1 billion.
Although there has been a very large increase in the U.S. trade in goods deficit with China, the year-to-year change in the trade deficit has fluctuated a great deal. As shown in the following chart, the year-to-year changes appear to have stabilized and even decreased over the past seven years.
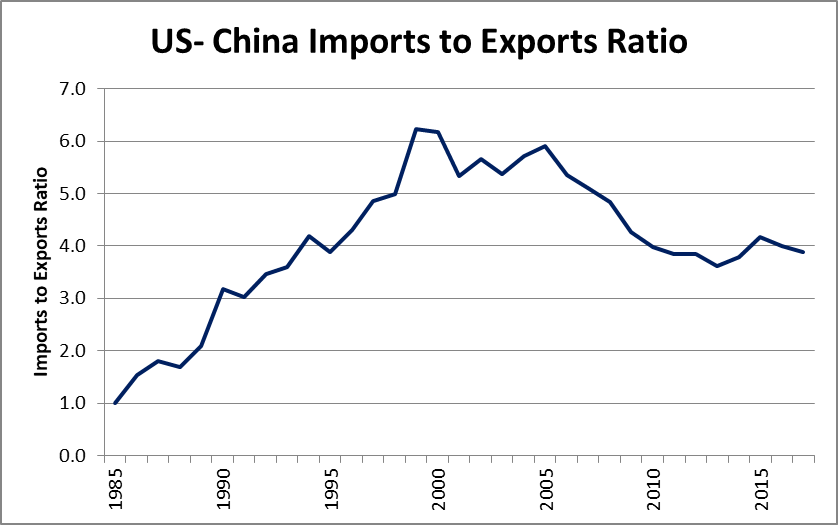
Another way of looking at the trade in goods relationship between the U.S. and China is the ratio of U.S. – China goods imports to exports. As shown below, this ratio hit a peak at 6.2 in 1999 and has moved lower since then. The ratio now stands at about 4.
Us china imports to exports ratio
So, what has happened since the trade war began earlier this year? First, it needs to be said that tariffs do not directly address the major complaints the United States has regarding Chinese trade practices. These complaints have to do with China’s failure to live up to free market reforms promised when it joined the WTO, expropriation of trade secrets from U.S. companies doing business in China, and industrial espionage. Thus, tariffs simply represent a warning shot and they may provide a means of getting China to address more substantive issues. In the mean time they are having disruptive effects on many U.S. businesses and they will likely cause price increases for many consumer goods. It has only been about six months since the first tariffs were announced, but trade and price statistics are starting to show some of the impacts.
The Bureau of Economic Analysis (BEA) issues quarterly bilateral trade reports. So far data exists only for the first two quarters of 2018. The following table shows year-to-year changes in U.S. – China exports, imports and trade balances for eight goods categories.
Year-to Year U.S. – China Goods Trade Changes, First and Second Quarter of 2018
In response to U.S. tariff increases, China has imposed reciprocating tariffs on a number of agricultural commodities. The BEA statistics do show a decline during both the first and second quarters in the value of food, feed and beverage exports. Even though the China tariffs on U.S. agricultural commodities did not take effect until the second quarter, it began stockpiling some commodities earlier in the year.
Soybean exports have been particularly hard hit. A recent American Farm Bureau report (October 23, 2018) indicated that during the first seven weeks of the 2018/2019 market year (September 1 through August 31) that soybean exports to China declined by 97 percent compared to the prior year. Since peaking on March 5th at $10.77 per bushel, the cash price for soybeans has dropped to $8.93 per bushel on November 30th, which equals a 17 percent decrease.
The BEA data also shows a decline in exports to China of autos, auto parts and engines. During June, July and August U.S. motor vehicle exports to China decreased by $506.3 million (50.3%), $296.2 million (46.7%), and $599.3 million (55.7%), respectively (Forbes, October 25, 2018). A third category of U.S. exports that has declined since the imposing of tariffs is consumer goods.
On the import side of the trade ledger, U.S. tariffs seem to be having the greatest impact on food, feed and beverages and on consumer goods. However, since most of the new U.S. tariffs on Chinese produced consumer goods only took effect in mid-September prices for items such as apparel, footwear, toys, computers, and other electronics have not yet been passed on to U.S. consumers. Where price impacts seem to be showing up are for goods, such as motor vehicle parts and for steel products. Since the tariffs on steel and aluminum were the first ones imposed back in March the prices of domestically produced goods with high steel or aluminum content have begun to increase. Examples of year-over-year price changes for selected goods are presented in the following table.
Year-over-Year Price Changes for Selected Consumer and Producer Goods, January – October 2018
Finally, the balance of trade for goods between the United States and China appears to show some impact of the tariffs. Although the trade in goods deficit with China increased during both the first and second quarters of 2018, the increase in the deficit during the second quarter was only about one-fifth of the size of the increase during the first quarter. The greatest change occurred in the consumer goods category. During the first quarter the U.S. consumer goods deficit with China grew by $6.1 billion, but during the second quarter the deficit shrank by $93 million. There was also a large change in the industrial supplies and materials category. During the first quarter the trade deficit with China in this category increased by $494 million, while during the second quarter the deficit declined by $854 million compared to the prior year.
Quarterly bilateral trade statistics for the third quarter will be released by the BEA in mid-December. These should provide a clearer picture of the impact of tariffs on the trade in goods flows between the United States and China.
Next the services….


