Uncategorized

New Trends: Wages, Sectors, & Workers

Something new here too. Since 2006 wage gains among production workers are stronger than for all workers in all but four sectors, which suggests, of course, that managers are falling behind.

The Bureau of Labor Statistics has wage data for manufacturing production workers running back to 1939. In 1939, average hourly earnings for nondurable manufacturing were just 52% of those for durable manufacturing, 34 vs. 65 cents, but rose almost straight up in the 1940s to 80% and continued to drift up to their current 89%.

In the Trade, Transportation and Utilities sector, however, retail wages have lost ground, falling from 84% of TTU wages, to 80% currently, while wages for transportation & warehousing have fallen from 127% to 110%. Wages for wholesale trade have risen from 109% of TTU wages to 126%, while utility workers have seen their wages climb from 132% to 184%.

Back in 1964, when records were established for the goods producing and service providing sectors, wages were even, but by the 1980s wages for services had slipped to 80% of goods. They began a rocky climb back up and have levelled out at about 94% currently. Since 1964, construction and manufacturing wages have risen by similar percentages, but logging & mining wages have gained an additional fifteen percentage points.

We’re looking back to 2006 now because that is as far back as the all-worker series goes. Since then, wages in logging and mining have made the strongest gains, up 49%, to $28.96, followed by leisure & hospitality, up 47% to $14.11. Production workers in finance and in professional & business services made similar percentage gains, to about $27.00, as did construction work, to about $28.00. Since 2006, wages in services are up 40% and in goods up 36%.

Weakest gains for production workers are in manufacturing, transportation & warehousing, and retail trade, all up around 30% to $21.77, $22.07, and $16.15 for retail.

Since 2006, however, production workers have seen greater wage gains than all workers in all but four sectors, so managers are dragging that broad tranche down. In manufacturing production workers lagged all workers by 1 percentage point, in durable manufacturing by 3pps, in utilities by 5pps, and in information by 11pps. In leisure & hospitality, production workers were 6pps ahead; in retail trade, 5pps; and in logging & mining, construction, and education & health, all ahead by 4pps.

Over the last year, production workers wages are up over 5% in logging & mining, up 4% or more in information, retail trade, leisure & hospitality, and construction. In only other services, 1.9%, and finance, 1.6%, are they up less than 2 percent.

Over the last year wages for all workers in information, a struggling sector by other measures, are up 6%, up 4% or more in construction, retail trade, leisure & hospitality, and finance, followed by a string of 2-3% gains, with non-durable manufacturing, and transportation & warehousing reporting the weakness growth at 1%.

The wage picture is certainly complicated, with some of the largest percent gains occurring side by side between the highest and the lowest hourly wages, and quite a few “not as we expected” trends. By a number of metrics the different sectors are going in different directions, which further confuses an already cloudy picture.

by admin· · 0 comments · TLR Wire, Uncategorized

New Trends: Education and Party in Michigan

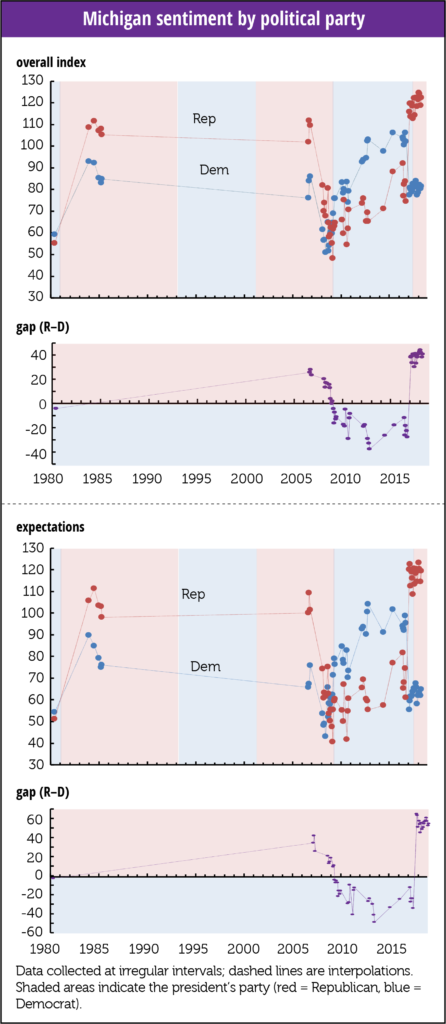
First, party: The University of Michigan collects data by political party only sporadically, so we don’t have a full history but, as we brought up at the time, last May, Richard Curtin, the guy who puts it all together, noted that in fifty years, the survey had never recorded as “dominant a political effect,” as it did in early 2017. Curtin expected that divergence to converge, but instead it widened.

Here’s the graph we ran:

During the years Trump has been President, Republican sentiment has averaged 117.6; while that of Democrats averaged 80, meaning Republican sentiment is running 46 points above the Obama years, while sentiment among Democrats is running just 13 points below. Both calculations exclude the depth of the recession years, when the divergence straitened to just 9 points; whoever thought we’d remember anything reassuring about those years.

That effect continues. In an October presentation Dr. Curtin identified his “major underlying issue,” as whether economic expectations surveys can retain their predictive ability given their “responsiveness to political rather than economic developments.” He quotes some observers who believe the partisan effect is “uniquely tied to the Trump administrations,” but his research suggests it is tied to our old friends income inequality and wage stagnation.

Second, educational attainment: Curtin also revisited the fact that the partisan divide between those with college-degrees remains “very low and insignificant,” and built on the striking observation he made back in May: the demographics really changed in 2017. Through 2016, generally, assessments of economic possibilities rose with income and education, and fell with age.

That changed in 2017.

Overall expectations for those with less than a high school degree had risen from 68 in October 2016 to 82 by August 2017, but fell for those with a college degree from 87 to 80. For those 65+ they rose from 2016’s 69 to 83 in 2017, while slipping a bit, to 86, for those 18 to 34 years old.
May 14, 2018
Sentiment for all three education terciles tracked each other closely throughout the series, all peaking around 2000, high school at 100 and the two college groups at 120, before falling raggedly to about 60 in the recession. The current divergence is led by an increase in the outlooks of the two lower attainment levels while those with a college degree are basically flat.

Curtin suggests that those with “relatively low job skills, as proxied by education, were the most affected by Trump’s election.” As we mentioned when we first brought this up, it’s a good thing if people with lower skills can do better.

But it’s a very bad thing if partisanship is putting a dent in the value of formerly trusted economic data.

by admin· · 0 comments · TLR Wire, Uncategorized

New Trends: Education and Party in Michigan

First, party: The University of Michigan collects data by political party only sporadically, so we don’t have a full history but, as we brought up at the time, last May, Richard Curtin, the guy who puts it all together, noted that in fifty years, the survey had never recorded as “dominant a political effect,” as it did in early 2017. Curtin expected that divergence to converge, but instead it widened.

Here’s the graph we ran:

During the years Trump has been President, Republican sentiment has averaged 117.6; while that of Democrats averaged 80, meaning Republican sentiment is running 46 points above the Obama years, while sentiment among Democrats is running just 13 points below. Both calculations exclude the depth of the recession years, when the divergence straitened to just 9 points; whoever thought we’d remember anything reassuring about those years.

That effect continues. In an October presentation Dr. Curtin identified his “major underlying issue,” as whether economic expectations surveys can retain their predictive ability given their “responsiveness to political rather than economic developments.” He quotes some observers who believe the partisan effect is “uniquely tied to the Trump administrations,” but his research suggests it is tied to our old friends income inequality and wage stagnation.

Second, educational attainment: Curtin also revisited the fact that the partisan divide between those with college-degrees remains “very low and insignificant,” and built on the striking observation he made back in May: the demographics really changed in 2017. Through 2016, generally, assessments of economic possibilities rose with income and education, and fell with age.

That changed in 2017.

Overall expectations for those with less than a high school degree had risen from 68 in October 2016 to 82 by August 2017, but fell for those with a college degree from 87 to 80. For those 65+ they rose from 2016’s 69 to 83 in 2017, while slipping a bit, to 86, for those 18 to 34 years old.

Sentiment for all three education terciles tracked each other closely throughout the series, all peaking around 2000, high school at 100 and the two college groups at 120, before falling raggedly to about 60 in the recession. The current divergence is led by an increase in the outlooks of the two lower attainment levels while those with a college degree are basically flat.

Curtin suggests that those with “relatively low job skills, as proxied by education, were the most affected by Trump’s election.” As we mentioned when we first brought this up, it’s a good thing if people with lower skills can do better.

But it’s a very bad thing if partisanship is putting a dent in the value of formerly trusted economic data.

by admin· · 0 comments · TLR Wire, Uncategorized

China Trade & Tariffs: First the goods

This is a dense post but there is a lot of data here and it’s worth knowing.

President Trump in his trade war with China has fixated narrowly on the U.S. – China imbalance between the export and import of goods between the two nations. The Census Bureau maintains a trade in goods by country dataset that includes import and export amounts in nominal dollars back to 1985. The chart below shows the trade in goods deficit with China from 1985 through 2017 in both nominal (blue) and real (red) dollars.
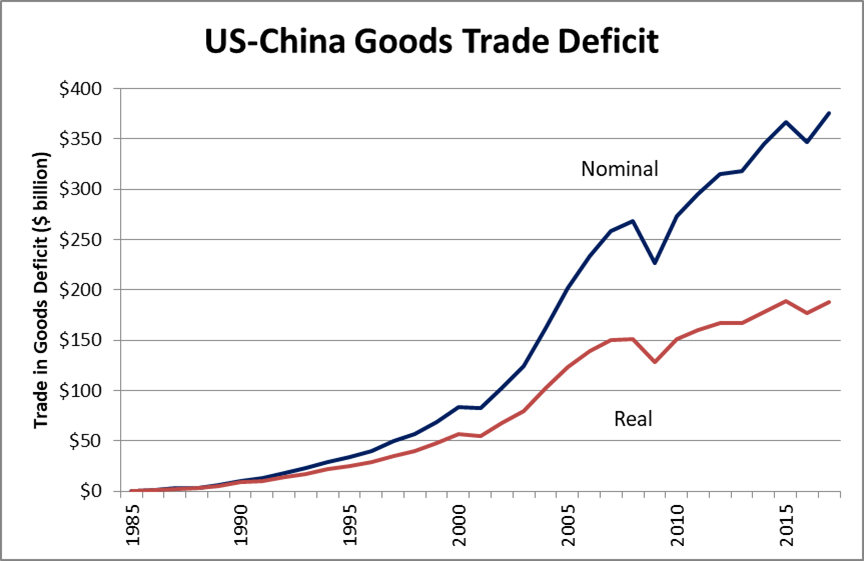
In 1985 the goods trade between the United States and China was about equal. By 2000, the nominal trade in goods deficit grew to $83.3 billion. From 1985 to 2000, U.S. goods exports to China rose from $3.9 billion to $16.2 billion, or by $12.3 billion (319.8%). Over the same period, U.S. goods imports from China increased from $3.9 billion to $100.0 billion, or by $96.1 billion (2,490.0%).

As large as the increase in Chinese exports to the United States was from 1985 to 2000, that growth has been eclipsed by the growth since 2001, when China was admitted to the World Trade Organization (WTO). From 2001 through 2017 Chinese goods exported to the United States jumped from $102.3 billion to $505.5 billion, or by $403.2 billion (394.2%). Over the same years U.S. goods exports to China grew from $19.2 billion to $129.9 billion, or by $110.7 billion (577.2%).

Over the entire period from 1985 through 2017 nominal goods exports from the U.S. to China grew by $126.0 billion (3,268.9%). Goods imports from China over this period grew by $501.6 billion (12,989.3%). The nominal value of the trade in goods deficit rose from $6.0 million in 1985 to $375.6 billion in 2017. Adjusted for inflation the trade in goods deficit in 2017 (in $1985) equaled $188.1 billion.
Although there has been a very large increase in the U.S. trade in goods deficit with China, the year-to-year change in the trade deficit has fluctuated a great deal. As shown in the following chart, the year-to-year changes appear to have stabilized and even decreased over the past seven years.

Another way of looking at the trade in goods relationship between the U.S. and China is the ratio of U.S. – China goods imports to exports. As shown below, this ratio hit a peak at 6.2 in 1999 and has moved lower since then. The ratio now stands at about 4.
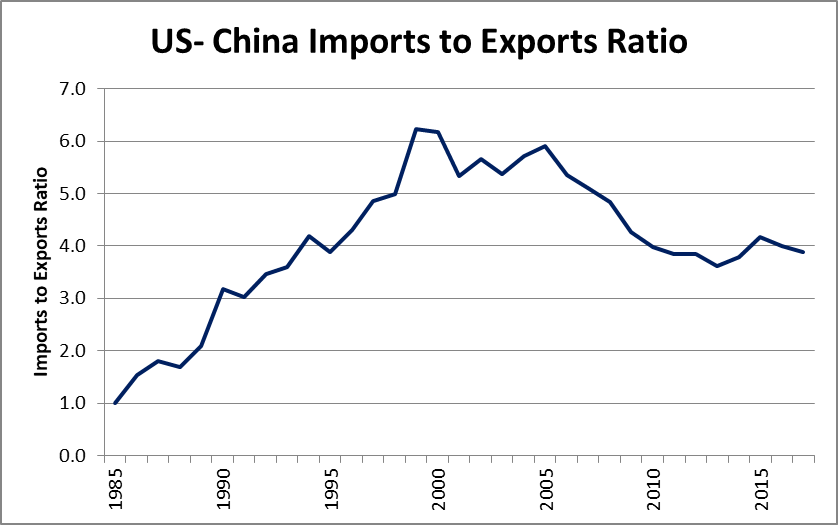
Us china imports to exports ratio
So, what has happened since the trade war began earlier this year? First, it needs to be said that tariffs do not directly address the major complaints the United States has regarding Chinese trade practices. These complaints have to do with China’s failure to live up to free market reforms promised when it joined the WTO, expropriation of trade secrets from U.S. companies doing business in China, and industrial espionage. Thus, tariffs simply represent a warning shot and they may provide a means of getting China to address more substantive issues. In the mean time they are having disruptive effects on many U.S. businesses and they will likely cause price increases for many consumer goods. It has only been about six months since the first tariffs were announced, but trade and price statistics are starting to show some of the impacts.

The Bureau of Economic Analysis (BEA) issues quarterly bilateral trade reports. So far data exists only for the first two quarters of 2018. The following table shows year-to-year changes in U.S. – China exports, imports and trade balances for eight goods categories.

Year-to Year U.S. – China Goods Trade Changes, First and Second Quarter of 2018

In response to U.S. tariff increases, China has imposed reciprocating tariffs on a number of agricultural commodities. The BEA statistics do show a decline during both the first and second quarters in the value of food, feed and beverage exports. Even though the China tariffs on U.S. agricultural commodities did not take effect until the second quarter, it began stockpiling some commodities earlier in the year.

Soybean exports have been particularly hard hit. A recent American Farm Bureau report (October 23, 2018) indicated that during the first seven weeks of the 2018/2019 market year (September 1 through August 31) that soybean exports to China declined by 97 percent compared to the prior year. Since peaking on March 5th at $10.77 per bushel, the cash price for soybeans has dropped to $8.93 per bushel on November 30th, which equals a 17 percent decrease.

The BEA data also shows a decline in exports to China of autos, auto parts and engines. During June, July and August U.S. motor vehicle exports to China decreased by $506.3 million (50.3%), $296.2 million (46.7%), and $599.3 million (55.7%), respectively (Forbes, October 25, 2018). A third category of U.S. exports that has declined since the imposing of tariffs is consumer goods.

On the import side of the trade ledger, U.S. tariffs seem to be having the greatest impact on food, feed and beverages and on consumer goods. However, since most of the new U.S. tariffs on Chinese produced consumer goods only took effect in mid-September prices for items such as apparel, footwear, toys, computers, and other electronics have not yet been passed on to U.S. consumers. Where price impacts seem to be showing up are for goods, such as motor vehicle parts and for steel products. Since the tariffs on steel and aluminum were the first ones imposed back in March the prices of domestically produced goods with high steel or aluminum content have begun to increase. Examples of year-over-year price changes for selected goods are presented in the following table.

Year-over-Year Price Changes for Selected Consumer and Producer Goods, January – October 2018

Finally, the balance of trade for goods between the United States and China appears to show some impact of the tariffs. Although the trade in goods deficit with China increased during both the first and second quarters of 2018, the increase in the deficit during the second quarter was only about one-fifth of the size of the increase during the first quarter. The greatest change occurred in the consumer goods category. During the first quarter the U.S. consumer goods deficit with China grew by $6.1 billion, but during the second quarter the deficit shrank by $93 million. There was also a large change in the industrial supplies and materials category. During the first quarter the trade deficit with China in this category increased by $494 million, while during the second quarter the deficit declined by $854 million compared to the prior year.

Quarterly bilateral trade statistics for the third quarter will be released by the BEA in mid-December. These should provide a clearer picture of the impact of tariffs on the trade in goods flows between the United States and China.

Next the services….

by admin· · 0 comments · Uncategorized

Protected: US employment & wage detail, productivity, and cynicism

This content is password protected. To view it please enter your password below:

by admin· · Enter your password to view comments. · Uncategorized