Fed Focus

Fact Checking with James Bullard

Saint Louis Fed President James Bullard has been speaking out a lot recently. He recently proposed a new interest rate regime that, instead of focusing on models, uses a very intuitive decision tree to determine if raising rates is appropriate. He gave a speech at the end of last week that asked three questions: would the US see GDP growth greater than 2% in the coming year, would inflation hit the Fed’s 2% inflation target and would wages increase as unemployment decreases. His answer to all three was, “Probably not.” And in a break from tradition, he relies on incoming data rather than models to support his conclusions.

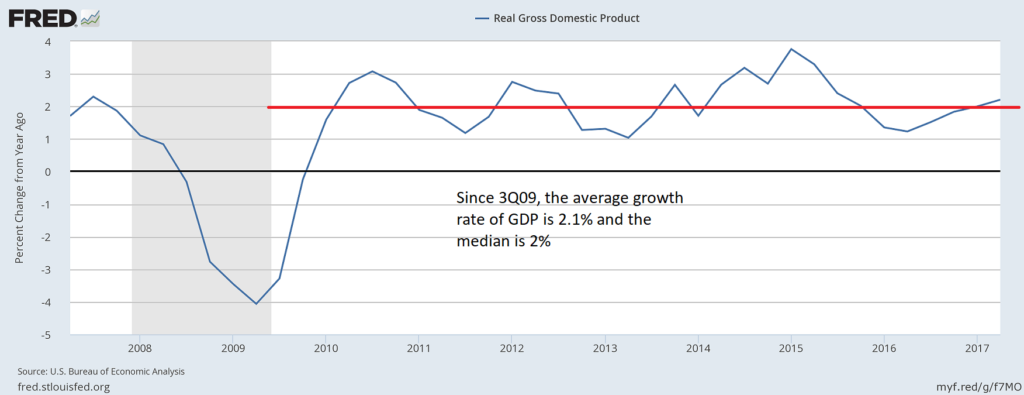
Bullard first observes that U.S. growth since the end of the great recession has converged to 2%. The following graph illustrates his point:

Since the third quarter of 2009, the average Y/Y growth rate has been 2.1% while the median growth rate has been 2%. There is little reason to project anything but moderate growth in the third quarter. Industrial production and real retail sales have both slowed. The three-month average payroll job growth is 185,000 per month -a solid rate but not one that warrants robust growth projections. Real income excluding transfer payments continues to increase but at a slower rate. The New York Fed’s Nowcast for third quarter GDP growth is 1.46% while the Atlanta Fed is calling for 2.8% growth The average of these two projections is 2.1%, which happens to be the approximate average of the blue chip forecasting consensus. The preceding information supports Bullard’s argument that there is a low probability of anything but more moderate growth.

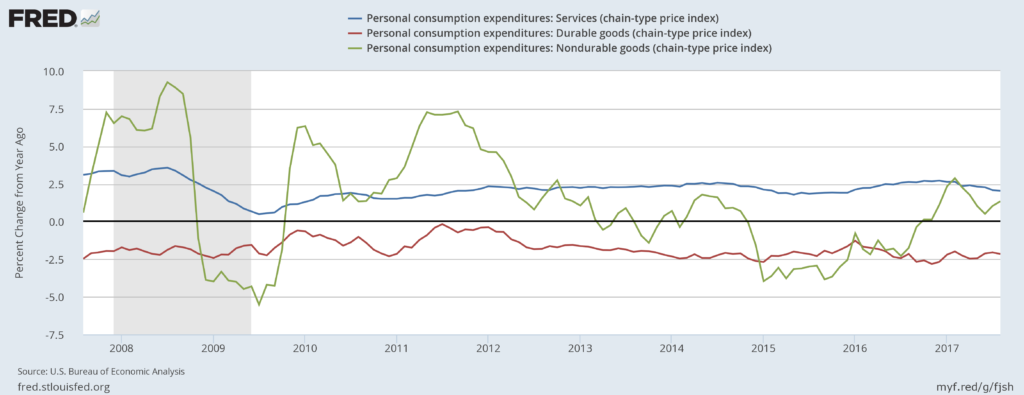
Bullard moves on to inflation, arguing that it is doubtful that inflation, as measured by the personal consumption expenditure price index, will broach the Feds 2% target. The following data supports his conclusion:

The BEA breaks PCE price data into three components: services, and durable and non-durable goods. Durable prices (in red, 10% of the index) have been subtracting from price pressures for the last 10 years. And their negative impact is pretty high: these prices have been contracting around 2% for the last year. Non-durable prices (in green, 20% of the index) are weak; they subtracted from inflation for all of 2015 and most of 2016, only recently adding any upward pressure. Their latest reading was for a 1.3% year-over-year rate of growthhardly anything to be concerned about. That leaves services (in red, 70% of the index) to create all the upward pressure that the Fed needs for PCE inflation to hit 2%. Statistically, that’s very difficult to do.

Several Fed governors have advanced different theories to explain why inflation is so weak. Some have argued that global supply chains allow producers to purchase products from low-cost areas, keeping internal price pressures low. Others have argued that real-time access to price information allows consumers to buy at the lowest cost, which continually squeezes retailers’ margins. Another theory states that an aging populationsuch as that in Japan, the EU, and the United Statesspends less, leading to lower demand, which translates into less demand-pull price pressures. Also consider that commodity prices are weak across the board, keeping input price pressures at bay. The real answer probably encompasses pieces of all these theories along with others that haven’t been considered yet. But regardless of the cause, it’s difficult to see why people continue to assert that inflation will return to 2% in the intermediate term. The data simply do not support that conclusion.

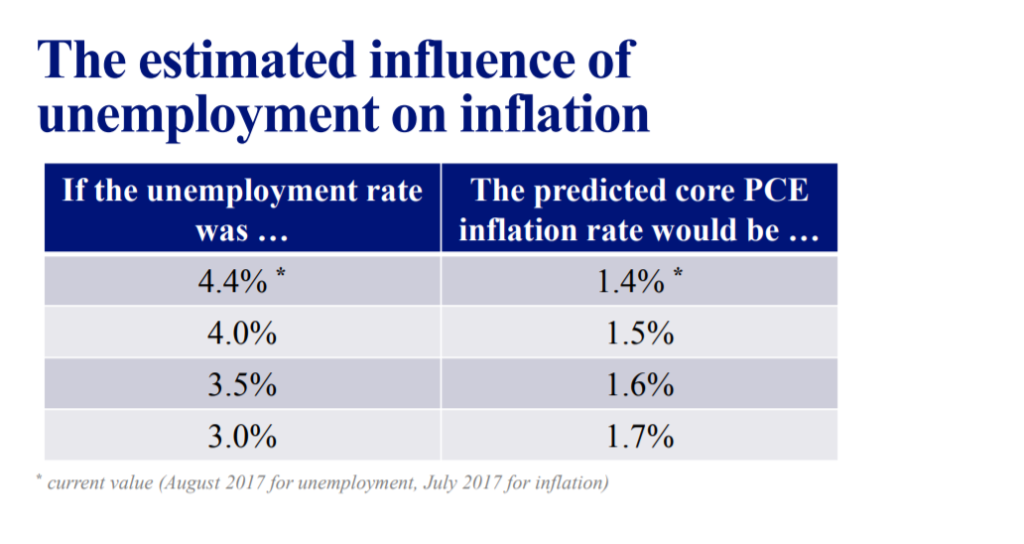
Bullard final point is that the Phillips curve is exceedingly flat. He offers the following table culled from academic research:

Clearly the unemployment rate/inflation rate relationship has weakened a lot. Minnesota Fed President Neel Kashkari, who was again the lone dissenter on June’s rate increase, offers the most logical explanation of this disengagement. To get around retirement issues and the like, he considers prime-age workers, and notes that their participation rate and employment/population ratio indicate there is more slack in the labor market than before the crash, and therefore there is room for improvement

by admin· · 0 comments · Fed Focus

2% target? Inflation Didn’t Get the Memo

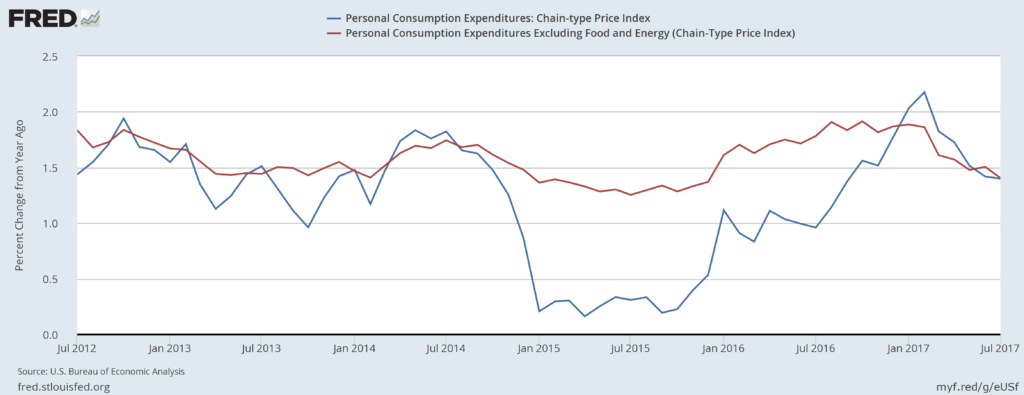
The Fed has publicly stated it has a 2% inflation target, but inflation has been stubbornly uncooperative in reaching that level. The PCE price deflator moved above 2% earlier this year, but has since fallen back, bringing both the overall and core rates back to 1.4%.

pce

The latest Fed minutes show, yet again, that the Fed is concerned about weak price pressures. We’re harping on this subject both because it’s very important, and because it reveals a bit of a dust-up within the Fed. Apparently there has been an ongoing debate within the Fed over showing a united front or encouraging dissent. We, of course, go with dissent, so to us the current inflation debate is encouraging.

Hale Stewart put together the following round-up of recent FOMC speak on that debate.

At their latest meeting, explanations for ongoing low inflation offered by the fed includedoffered by the Fed included:

… a diminished responsiveness of prices to resource pressures, a lower natural rate of unemployment, the possibility that slack may be better measured by labor market indicators other than unemployment, lags in the reaction of nominal wage growth and inflation to labor market tightening, and restraints on pricing power from global developments and from innovations to business models spurred by advances in technology. A couple of participants argued that the response of inflation to resource utilization could become stronger if output and employment appreciably overshot their full employment levels, although other participants pointed out that this hypothesized nonlinear response had little empirical support.

Fed Governors James Bullard and Lael Brainard have been the most vocal on the problem that inflation, in Bullard’s words, “doesn’t seem to be related to the variables that we think it should be related to.”

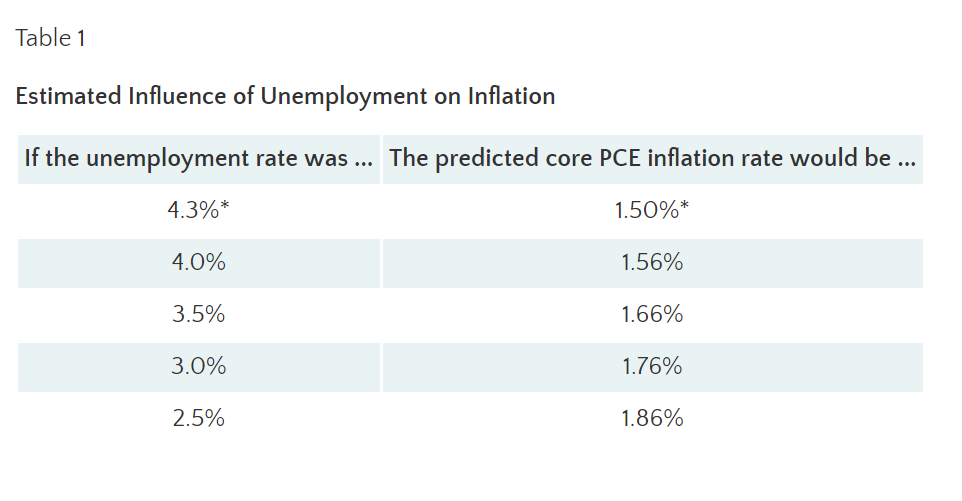
Last week Bullard posted comments on the St. Louis Federal Reserve’s blog focused exclusively on the Phillip’s Curve, which argues that as unemployment decreases, wages increased. This relationship was first observed in the 1950s and became part of central bank policy making soon thereafter. While the 1970s stagflation experience soured the Fed on this theory, it returned to prominence in the 1990s. As many, including the gang here, have argued, the relationship between employment growth and wages is weak at best. The table below shows that even a nearly impossible 2.5% unemployment rate would cause only a minimal increase in PCE inflation (36 basis points). This research indicates that a basic relationship assumed by the Fed is no longer supported by the data, if it ever truly was.
phillips-curve
With the Phillips’ Curve either very flat or broken, what should we consider as the causes of current very low inflation? Lael Brainard – one of the Fed’s brightest lights – offers several explanations starting with import prices:

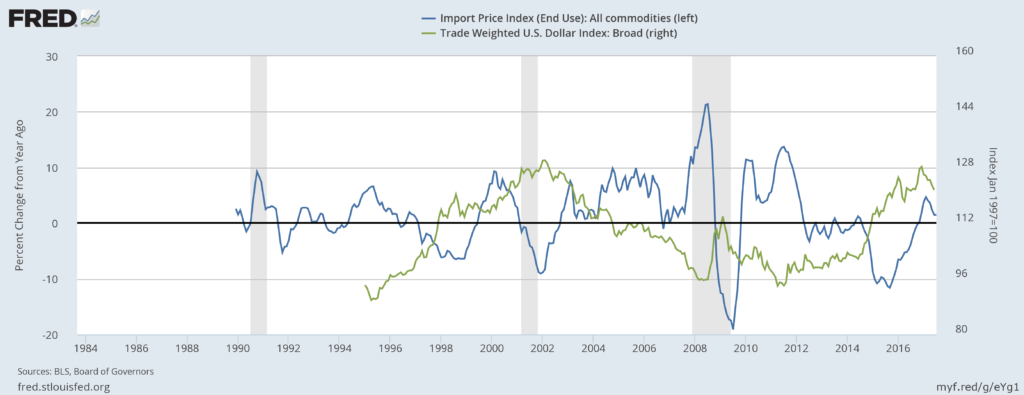
One key factor that may have played a role in the past three years is the decline in import prices, reflecting the dollar’s surge, especially in 2015. By contrast, in the 2004‑07 period, non-oil import prices increased at roughly a 2 percent annual rate and had a more neutral effect on inflation. Nonetheless, while the decline in non-oil import prices likely accounts for some of the weakness in inflation over the past few years, these prices have begun rising again in the past year at a time when inflation remains relatively low.

The following graph illustrates her point:

import-pr

The trade-weighted dollar (in green, of course) decreased 25% between 2002-2008. At the same time, import prices rose at fairly sharp rates. The exact opposite happened during this expansion: the dollar increased a little over 30% causing import prices to contract from 2012 to the beginning of 2017.

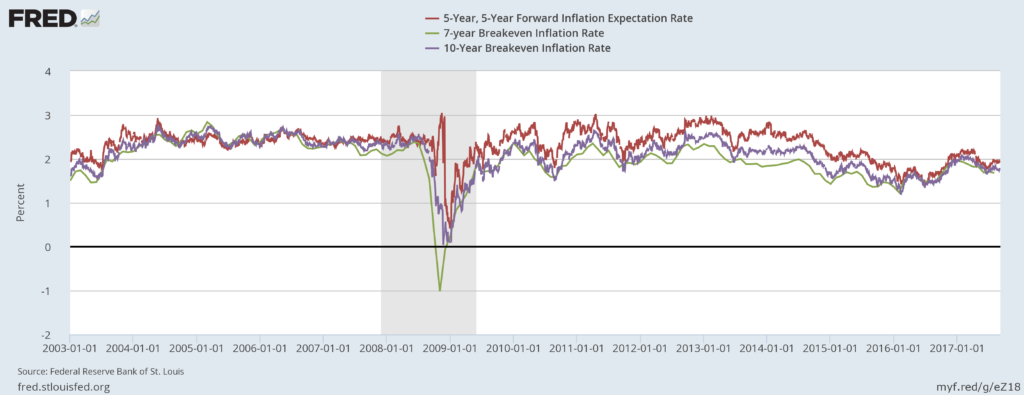
She also argues that underlying inflation–as well as inflation expectations–has decreased, which is best illustrated by the breakeven inflation rate, which subtracts the yields of TIPS, Treasury Inflation Protected Securities, from the corresponding treasury.

be-inflation

The 5-year (in red) and 10-year (in purple) breakeven rate each fluctuated around 2.5% during the previous expansion. But each has decreased in fairly pronounced ways in the last 4 years. The 5-year has dropped about 100 basis points while the 10-year is down about 75 basis points. This graph indicates that people believe price pressures are declining, so they’re demanding less interest as compensation.

Brainard offers two reasons why inflation expectations are declining:

One simple explanation may be the experience of persistently low inflation: Households and firms have experienced a prolonged period of inflation below our objective, and that may be affecting their perception of underlying inflation. A related explanation may be the greater proximity of the federal funds rate to its effective lower bound due to a lower neutral rate of interest. By constraining the amount of policy space available to offset adverse developments using our more effective conventional tools, the low neutral rate could increase the likely frequency of periods of below-trend inflation. In short, frequent or extended periods of low inflation run the risk of pulling down private-sector inflation expectations. (Note: Bullard has argued that the recent trend is the best indicator of inflation’s direction.)

The first theory has been advanced to explain Japan’s low inflation expectations, but while there is a correlation between the two statistical events, we don’t know if there is causation. The second is related to recent research from the San Francisco Fed, which observed that the natural rate of interest is abnormally low and has been for the duration of this expansion. Low interest rates can’t exist if inflation is high because at some point, the markets will demand sufficient compensation to the natural devaluation of this money.

As we noted last week, the Fed moves at a glacial pace, so don’t expect a sea change in their collective inflation thinking. In fact, several other speeches this week indicate that some governors are continuing to argue low inflation is transitory. However, Bullard and Brainard have at least put the ball in play and offered substantive evidence supporting a rethinking of the Fed’s recent inflation targeting failures. And we believe they won’t drop that ball.

by admin· · 0 comments · Fed Focus

The Fed: Climate Change Ahead?

My formative years stretched from the mid-1970s to mid-1980s. While my economic awareness of the time was at best weak, I do remember that inflation was a very important issue that was constantly on my father’s mind. In case you’re wondering, the “I” in this piece is Hale Stewart.

It’s also obvious that this period haunts today’s central bankers as they continue to worry about inflationary pressures despite all evidence to the contrary. But the latest minuteswhich were released on Wednesdayshow a Fed that is beginning to realize some of them just may have it wrong.

Let’s start with their observations about the current state of inflation:

Total U.S. consumer prices, as measured by the PCE price index, increased 1-1/2 percent over the 12 months ending in May. Core PCE price inflation was also 1-1/2 percent over that same period. Over the 12 months ending in June, the consumer price index (CPI) rose 1-1/2 percent, while core CPI inflation was 1-3/4 percent. The median of inflation expectations over the next 5 to 10 years from the Michigan survey edged up both in June and in the preliminary reading for July. Other measures of longer‑run inflation expectations were generally little changed, on balance, in recent months, although those from the Desk’s Survey of Primary Dealers and Survey of Market Participants had ticked down recently.

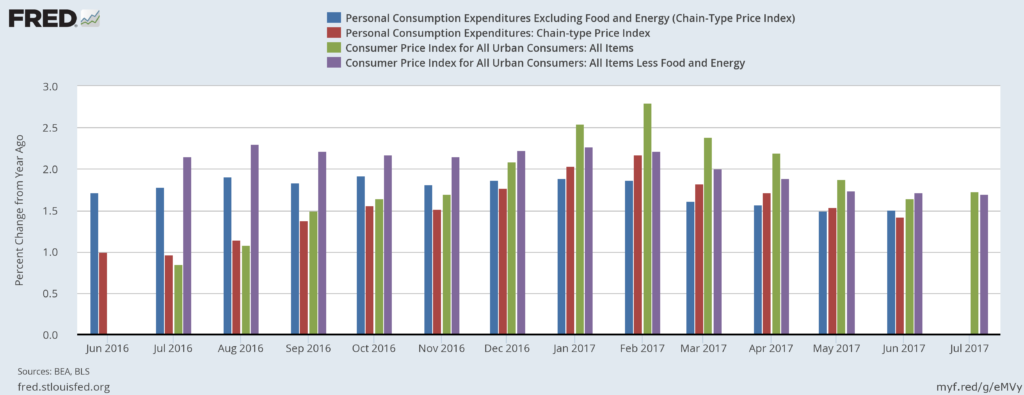
Let’s put that into quantitative perspective:

fredgraph-5

The chart above show 12 months of the Y/Y percentage change in core and overall CPI and PCE prices. Core CPI is purple. It was greater than 2% until April and has been below the Fed’s target since. The green bar is overall CPI, which was greater than 2% for five months but fell below 2% in April. The bottom chart tracks the same data over the most recent 5-year period; none of these measures meaningfully breached 2% in that stretch. The conclusion is clear: inflation has not meaningfully penetrated the Federal Reserve’s 2% target since 2012.

The next paragraph discussing inflation highlights the fed’s inflation projections:

The staff’s forecast for consumer price inflation, as measured by the change in the PCE price index, was revised down slightly for 2017 in response to weaker-than-expected incoming data for inflation. As a result, inflation this year was expected to be similar in magnitude to last year, with an upturn in the prices for food and non-energy imports offset by a slower increase in core PCE prices and weaker energy prices. Beyond 2017, the forecast was little revised from the previous projection, as the recent weakness in inflation was viewed as transitory. The staff continued to project that inflation would increase in the next couple of years and that it would be close to the Committee’s longer-run objective in 2018 and at 2 percent in 2019.

This line of reasoning is becoming increasingly perplexing. Although the Fed acknowledges that near-term inflationary pressures are weak and are getting slightly weaker–the Board once again concludes that prices will hit the Fed’s 2% target in the coming years. For the last few years, the Board has consistently believed that price pressures will perform as projected despite all evidence to the contrary.

A later paragraph not only explains why the Fed continues to use this thinking, but also presents several reasons why perhaps they should drop it:

A number of participants noted that much of the analysis of inflation used in policymaking rested on a framework in which, for a given rate of expected inflation, the degree of upward pressures on prices and wages rose as aggregate demand for goods and services and employment of resources increased above long-run sustainable levels. A few participants cited evidence suggesting that this framework was not particularly useful in forecasting inflation. However, most participants thought that the framework remained valid, notwithstanding the recent absence of a pickup in inflation in the face of a tightening labor market and real GDP growth in excess of their estimates of its potential rate. Participants discussed possible reasons for the coexistence of low inflation and low unemployment. These included a diminished responsiveness of prices to resource pressures, a lower natural rate of unemployment, the possibility that slack may be better measured by labor market indicators other than unemployment, lags in the reaction of nominal wage growth and inflation to labor market tightening, and restraints on pricing power from global developments and from innovations to business models spurred by advances in technology. A couple of participants argued that the response of inflation to resource utilization could become stronger if output and employment appreciably overshot their full employment levels, although other participants pointed out that this hypothesized nonlinear response had little empirical support.

The Fed’s model is based on a standard economic cause and effect theory: increased demand absorbs excess supply; this increases resource utilization beyond current production capacity; which forces producers to raise prices. Increased demand is also a signal to producers that they have pricing power – the ability to raise prices without negatively impacting demand.

Let’s take a look at some of the reasons the Fed raises as possible reasons for the disconnect between growth and prices late in the paragraph.

First up, a lower natural rate of unemployment: Consider Japan, where unemployment is currently below 3% yet inflationary pressures remain nonexistent.

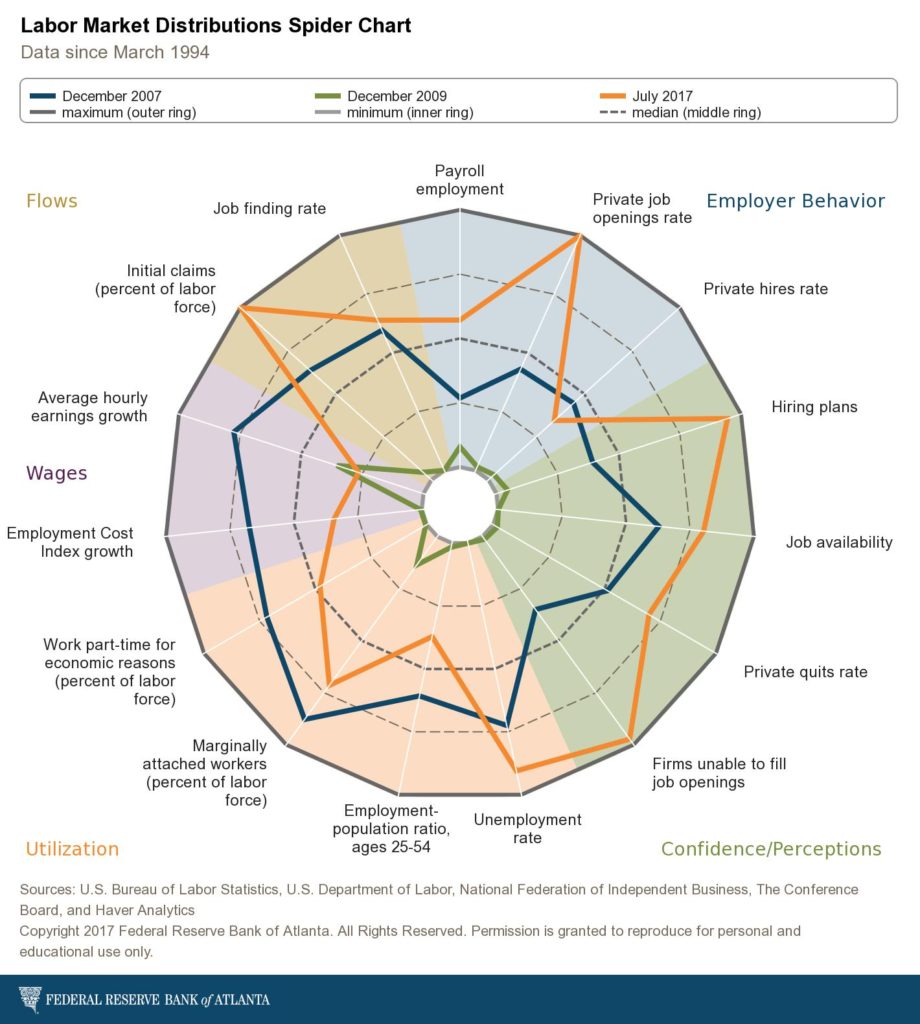
Next, the possibility that slack may be better measured by labor market indicators other than unemployment: here, the Atlanta Fed’s the labor market spider chart provides the necessary detail.

atlanta-fed_labor-market-historical-distributions-spider-chart

The lower left-hand corner of the chart shows three data points that quantify labor utilization: the employment to population ratio, employees working part time for economic reasons, and employees who are marginally attached to the labor force. Despite a nearly record long expansion, all three levels are still below previous peaks.

Restraints on pricing power from global developments and from innovations to business models spurred by advances in technology are real and here to stay. U.S. business is now competing against any company who has access to the U.S. market. Some of foreign competitors have lower cost structures, lowering their input costs. This, in turn, constrains prices.

The Fed is slow to act, so don’t expect them to radically change their policies or outlook overnight. However, it does appear they are re-evaluating their understanding of how inflation materializes in the economy and the looking for new relationships to explore. This is a very good development.

We hope they will take their own advice on that score. In a recent interview outlined here St. Louis President James Bullard brought up what drives inflation as a key issue, noting that, “…the answer you get from various angles is always the same: that inflation doesn’t seem to be related to the variables that we think it should be related to.” The Phillips Curve seems to have lost its swag. Bullard maintains it never had much, and that we’re better off looking at the recent trend to gauge inflation.

by admin· · 0 comments · Fed Focus, Uncategorized

Lael Brainard: Status Quo Not Good Enough

Last Friday, Fed Governor Lael Brainard addressed trainees attending the 20th annual summer program intended to advance diversity in the economics profession, a demanding and often lonesome trail. The program takes place at Michigan State U in East Lansing, and is sponsored by the American Economic Association and the National Science Foundation.

Brainard notes that, “Between 1995 and 2014, the share of women obtaining a doctorate in economics held roughly steady in the neighborhood of 30 percent. Among U.S. citizens and permanent residents earning doctorates, the representation of those identifying as black, Hispanic, or Native American among the pool of doctorate recipients improved from 6 percent in 1995 to 11 percent in 2007. But the improvement has since unwound and the underrepresented minority share stood at about 7 percent in 2014.” [This is at odds with progress in the other STEM professions.]

The idea that broadening diversity and opportunity is the right thing to do sometimes obscures the truth that it is best practice. As Brainard put it, “The quality of the economics profession and its contributions to society will be stronger when a broader range of people are engaged…. We now have substantial empirical evidence documenting the benefits of diversity in broadening the range of ideas and perspectives that are brought to bear on solving problems.”

If you’re a hard-nosed pragmatist interested only in results, perhaps you already knew this.

Here’s some of that evidence, accessed through Brainard’s footnotes, as well as some possible reasons and suggestions.

“Ethnic diversity deflates price bubbles,” tested the authors’ conjecture that bubbles can be thwarted by ethnic diversity. Looking at markets in Singapore and in Texas, they found that traders in homogenous markets are more likely to accept speculative prices, their errors are more tightly correlated, and when the markets crash they do so with a bigger bang than more diverse markets, where prices fit true value 58% more accurately.

A McKinsey study found that companies ranked in the top quarter by ethnic and racial diversity are 35% more likely to beat national industry means in financial returns, and companies ranked in the top quarter by gender diversity 15% more likely to do so. Companies in the bottom quarter are less likely than the average to produce above average returns, and therefore are not just not leading, they are dragging. This unequal performance suggests that diversity is a competitive differentiator.

And Credit Suisse reports that large-cap companies with at least one woman on the board have outperformed their peers who have no women on the board by 26% in the 6 years leading into 2012. That’s a bit of an old study. Perhaps it’s no longer true that there are large-caps that have no women on their boards.

And, the last word in stark…

Another Personality and Social Psychology study involved 3-person teams taken from the same fraternity or sorority house and tasked with solving a murder. Each “detective” worked independently to identify the most likely suspect and then joined up to provide a collective answer. A few minutes into the discussion the Greek groups were joined either by another member of their house or by an outsider. After turning in their answers, the more diverse groups thought their interactions were less effective than the homogenous teams, and were less confident in their conclusions.

But they were “starkly” wrong. The addition of an outsider doubled the teams’ chances of getting the correct answer, from 29% to 60%.

Tough is good

David Rock, Heidi Grant and Jacqui Grey, who wrote the HBR mentioned directly above, believe that working with people who are different from ourselves challenges our brains to overcome our “stale ways of thinking.”

The discomfort that caused the more diverse teams to feel less confident when they should have been more is the point: such difficulty improves the outcome and sharpens thinking. The authors cite a study carried out in mock juries where white jurors processed the facts of the case more carefully when blacks were added to the juries. So…

Why so slow?

In their, “Diversity in the Economics Profession: A New Attack on an Old Problem.” Amanda Bayer, Professor of Economics at Swarthmore, and Cecilia Rouse, Dean of the Wilson School of Public and International Affairs at Princeton, quickly get to some possible reasons for our lack of success in diversifying the economics profession, spotlighting evidence that “may be less familiar to economists,” than the problem itself.

Although many hypotheses advance math prep, instructor race/gender, past experience in economics as the culprits, it is hard to get to a conclusion. One team looked at a dataset for 11 large state universities and found that an array of variables, including aptitude, do not explain the disparity in going beyond that first intro economics course.

(We have an anecdote here. Coincidentally, one of us spoke with a college sophomore the other day. She had taken one economics course and passed on the second: the tenets that were taught did not fit with her own experience, and when she, therefore, questioned their validity, the professor’s answers did not convince her. She’s a chemistry/physics major, so it’s unlikely it was an aptitude issue. The conversation at the table was about economic issues, and she kept up with the grown-ups handily, but after that one class she had lost interest in the academic side.)

Other STEM fields are far more diverse: One study that found “no significant sex differences” in promotion of professors in fields with heavy math requirements, labeled economics an “outlier with a persistent sex gap that can’t be explained by productivity differences.” And, in 2014, women earned 43% of degrees in math and statistics, well above that 30% in economics.

Although implicit bias research has not been targeted to economics, the authors cite a study of economics professors up for tenure at the 30-top universities between 1975 and 2014. The study showed that while an additional co-authored paper has the same effect on a man’s chances of attaining tenure as does a paper he published on his own, women are penalized for co-authoring, especially if the co-author is male.

As an example of how deep such bias runs they note that in the business sector, a serious offender, identical research queries were sent under names designed to telegraph that the sender was Caucasian, African-American, Hispanic, Indian or Chinese. Eighty-seven percent of the “white” males received responses; only 62% of the others heard back. It seems unlikely that economics is not similarly plagued.

Let’s move on to some of the less-known possibilities. One unintended effect might be that economists generally don’t put together programs that would make the field more inclusive to under-represented populations. Bayer and Rouse wonder how much we can trust economists, who so often frame choices as “individual objective decision-making,” to police themselves for discrimination? In one role-playing experiment, men who thought of themselves as “objective and logical” were more likely to favor male applicants.

And it probably doesn’t help that salaries of female full-professors fell from 95% of those of males in 1995 to 75% in 2010.

Creative destruction to the rescue

Bayer and Rouse advance some concrete approaches. First and foremost they believe we need to revise how economics is taught. In recent years, the lecture has repeatedly been shown to be “inferior” to other teaching strategies, and yet it remains dominant.

Bayer and Rouse suggest professors adopt an ask rather than tell approach. This won’t bog down intro courses as students can use clickers to respond to questions quickly. Also, we could use more in-class experiments and labs, again rather than relying on lectures. Such active learning is all good in terms of higher scores and lower failure rates. And maybe those more diverse teams could come up with some better answers to those old economic questions we’re grappling with these days.

On the draw side, there’s attention to recruitment and mentoring programs, and abatement of bias and discrimination. Small changes can do a lot in things: balancing the number of women and minorities shown in class materials reduces stereotype threat. The Harvard study stresses that it’s better to be direct: acknowledging that differences exist and diversity is valued is far more effective than those somewhat humorous mock-ups that show one of every known stereotype beaming in unison. It’s also a good idea to wait a few seconds after asking a question so that the first students to raise their hands are not always the ones to answer questions. That way the more reticent students also have the important experience of public speaking.

Other small things include listening, encouraging, and giving credit to others for their ideas. What a concept.

by admin· · 0 comments · Fed Focus

Stanley Fischer: “Reasonable People Can Disagree”

Stanley Fisher bravely gave a talk on labor productivity last week—bravely because Robert Solow was in the audience, which Fischer acknowledged as an honor, a joy, and something of a difficulty. In his talk Fischer touched on a number of possible measurement problems, but, like the majority of serious researchers on the topic we have quoted over the years, sees no reason to believe there has been an increase in any measurement bias, meaning the long standing decline in productivity is not a measurement problem.

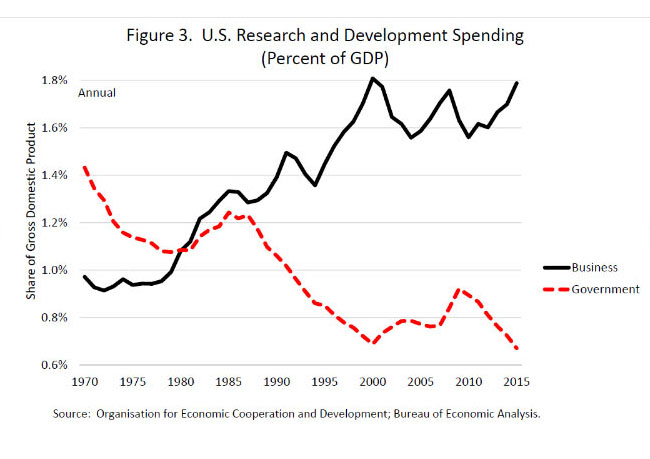
Fischer hauls out the old, and we’d say true, saw that public-sector research is responsible for the R part of the R&D pair, and the private sector is responsible for the D. This of course is a controversial statement, how many arguments have we all had on one side or the other? But the research in favor is pretty conclusive. The private sector has done wonders with the applications, but the basic materials are close to entirely produced in government or government-funded labs. (If you have evidence to the contrary, please send it along.)

That’s why Fischer calls the stunning trend shown below disturbing. We’d add it may go a long way toward debunking the idea that there’s any mystery cloaking current weakness in productivity.

pubpri

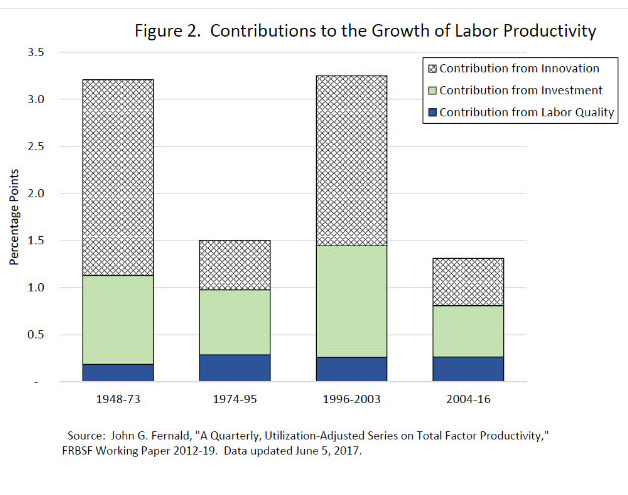
John Fernald, researcher at the San Francisco Fed who has had tremendous influence on the Federal Reserve’s overall thinking on the issue, has shown that labor’s contribution to productivity, driven by gains in educational attainment, etc., has been stable in the periods shown on the graph below, which were derived from his team’s work on the subject. Investment has been a dragging factor, but the real culprit appears to be innovation, the residual tracked by Total Factor Productivity. Somewhat elusive by nature, it’s designed to measure changes in output that cannot be explained by labor and capital. Belief in the power of that component of TFP was the Kool-aid of belief in the New Economy, but the contributions of formal and informal R&D, better management, gains driven by government-provided infrastructure (there would be no farming west of the Mississippi without federal water projects), and the creative destruction wreaked by highly productive firms on the trailers are certainly real.

inno

While we’re not graphing this, Fernald’s research shows that productivity contributions from IT producing industries peaked between 1995-2000, the contribution of IT-intensive firms increased ten-fold between 2000 and 2004, and then shrunk back to where it had been by 2007. Non IT-intensive firms plucked their low-hanging fruit by 2007, and their contribution disappeared by 2011. Many of the revolutionary increases in productivity took place in retail and wholesale trade, and in online brokerage back then. Nothing comparable is happening now.

Fischer believes that AI, his example is self-driving cars, medical technology (gene-driven treatments), and cheaper alternative fuels all suggest that we can reach for higher fruit, and raises the possibility that we may be in a productivity lull as these advances spread through the economy. He notes that it took decades for the steam-engine to make its changes. One hopes.

the Rule of 70

And Fischer cuts to the chase. In answering his rhetorical what does this matter?, he turns to his favored measure: how long it takes for productivity and, therefore, income, to double. During the 25 years between 1948 and 1973 when labor productivity was growing at 3.25%, it took labor productivity 25 years to double (70/3.25); in the 42 years between 1974 and 2016, with labor productivity growing an average 1.75%, it took 41 years to double. What is the difference between the prospects facing the young when per capita incomes are doubling every 22 years and when they are doubling every 41 years. An excellent reason to work to shift the tide.

Noting that reasonable people can disagree on how best to advance the objective, Fischer points out that another restraining factor may be uncertainty related to government policies, which stabilized in 2013, but was on the rise again in late 2016. Damping such uncertainty by more clarity is “highly desirable—particularly if the direction of policy itself is desirable.”

Perhaps we could harness some creative destruction and dismantle our $125 billion-dollar-a-year Grid Lock industry. (Forbes noted about 56% of that is direct, wasted time and fuel while sitting in traffic.) It’s a far cry from what we hoped for from the innovation residual, but perhaps we should try to recoup the kind of productivity gains that came with the interstate highway system in the 1950s and 1960s—only maybe with some 21st century modes of transportation instead?

by admin· · 0 comments · Fed Focus, Uncategorized