Inversion: What is the Yield Spread Telling Us Now?
A Little Background
On March 22nd the spread between the yields on 3-month and 10-year Treasury debt securities inverted. This reversal of the normal relation between yields for short- and long-maturity Treasuries typically signals an impending recession. Each of the past three recessions has been preceded by similar yield spread inversions.
The question often asked about this particular economic indicator is “Does it simply signal an impending recession, or does it somehow cause one to occur?” At least over the past thirty years inverted yield spreads have been followed by recessions. Depending on how long the inversion lasts and how large the reversal of yields is, the inversion can also be a major contributor to an economy’s decline into recession, something people tend to forget.
Particularly in more recent years, when banks have come to rely more on borrowed funds and less on savings deposits for the money they lend, a yield inversion has resulted in banks tightening their lending standards as the profitability of loans declines. This in turn can result in less business investment and slower economic growth.
In their 4th-quarter survey of senior bank loan officers, the Federal Reserve found a tightening of loan standards for commercial real estate, while standards for other commercial and industrial loans remained unchanged from the prior quarter. Combined with the finding that demand for all types of loans to households weakened, the results imply the nation is moving into a period of slower economic growth.
Here’s a review of some of the characteristics of the inverted yield spreads that preceded the past three recessions.
Yield Curve vs Yield Spread
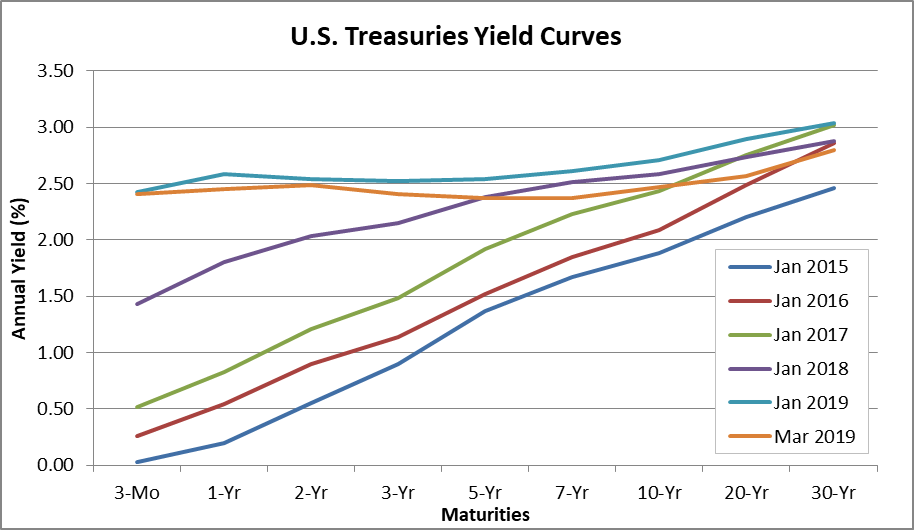
The yield curve shows the relationship among the yields across all Treasury debt maturities. A single yield curve shows the relationship among the yields for different maturity Treasury debt securities at a single point in time. Graphing multiple yield curves on the same axes reveals changes in the location and slope of the curve over time.
The following chart presents yield curves based on average monthly yields for each of the past five Januaries and for March 2019. For January 2015, 2016 and 2017 the curves are generally parallel but move up by about 0.5pps between 2015 & 2017. In 2018 the curve begins to rotate and flatten with the yield for the 3-month Treasury bill rising by 0.91% from January 2017 to January 2018, while for 30-year Treasury bonds the yield declined by 0.14%.
By January 2019, the yield for the 3-month Treasury bill moved up to 2.42%, 0.99% above the average yield in January 2018. The yield of the 30-year Treasury bond averaged 3.04%, just 0.16% above the prior January, meaning that at the beginning of this year the spread was just 0.62%. During March 2019, the 3-month yield held at about 2.41%, and the 30-year bond yield fell to 2.80%, which reduced the spread from the bottom to the top of the curve to just 0.39%. Of greatest interest: In March, the yields for the 5-year and 7-year notes fell below the yield for 3-month Treasury bills.
The yields for any two debt securities may be used to compute a yield spread. As the result of past studies, attention has focused on the spread between the 3-month Treasury bill and the 10-year Treasury note yields because this particular spread has proven to be a particularly good predictor of coming recessions about one year into the future. The following chart from the St. Louis Federal Reserve Bank economic data site shows this relationship.
As the chart shows, inversions do not occur suddenly, but after a long period of decline in the spread between the yields of these two Treasury debt maturities. For example, the decline in the 3-month to 10-year yield spread began in April 5, 2010. Nevertheless, given the current apparent strength of the U.S. economy, and the long period of law rates, some skeptics believe this time is different, and that the U.S.economy will not slip into recession over the next year.
So let’s take a look at the conditions that led up to the last three recessions to see if such skepticism is justified, including the date the spread first inverted, the length of the inversion, the maximum value of the inversion, the changes in the 3-month and 10-year yields that caused the inversion, changes in Fed policy an inflation, and the lag between the end of the inversion and the beginning of the recession.
Note bene: For all three cycles, the yield spread peaked between 3.76% and 3.85%.
Cycle 1: October 28, 1987 through November 6, 1992
At the beginning of this cycle the yields for the 3-month and 10-year Treasuries were 5.25% and 9.01%, resulting in a spread of 3.76% and the Fed’s federal funds rate target was 7.31%, while the year-over-year rate of change in the consumer price index (CPI) was 4.36%, the good old days.
During this cycle 17 months elapsed between the maximum value and the inversion. Over that period the yield on the 3-month Treasury bill rose by 4.20%, from 5.25% to 9.45%, and federal funds target rate increased by only 2.4% from 7.3% to 9.8%. The yield on the 10-year Treasury note increased only slightly from 9.01% to 9.44%, and the rate of inflation ticked up by 0.53% from 4.36% to 4.89%. That means most of the decline in the spread occurred due to an increase in the 3-month Treasury bill yield. The increase in the 3-month yield may have been partially due to the increase in the federal funds target rate, but other factors must have played a role since the 3-month yield increased by much more than the target rate.
And the expectation of continued relatively high inflation, running at 5% when the inversion occurred, surely influenced both the 3-month and 10-year yields.
The spread initially inverted on March 27, 1989, and almost two months the cycle’s extended inversion period began, running from May 22, 1989 until December 28, 1989. The maximum inversion occurred on June 9, 1989, -0.35%, and the spread was negative for 98 (44.5%) of the 220 days of inversion.
This economic cycle’s recession began during July 1990, 15 months after the 3-month to 10-year yield spread initially inverted, and run for eight months into March 1991. Unemployment peaked at 7.8%, GDP dropped by 1.4%, and at the end of the recession inflation remained at a relatively high 4.82%, little changed from the beginning, and the federal funds target rate was 6.0%.
Cycle 2: November 6, 1992 through May 13, 2004
At the start of this cycle the yield for the 3-month Treasury bill was 3.13% and the yield for the 10-year Treasury note, 6.97%, giving a 3.84% spread. The federal fund target rate was 3.00% and the year-over-year growth rate of the CPI equaled 3.12%.
This is a different picture, and the close correspondence of the 3-month yield, the federal funds target rate, and the CPI growth rate is noteworthy. During this cycle the 3-month and 10-year Treasury yields initially inverted on September 10, 1998, with the 3-month yield at 4.78%, the 10-year yield at 4.76%, and the federal funds target at 5.50%, while the CPI measure of inflation stood at only 1.43%.
Following the initial inversion 22 months elapsed before an extended inversion period began, extending from July 7, 2000 until February 9, 2001. During this 217 day period, the yield spread was negative for 61.3% of the period, or 133 days. The deepest inversion occurred on January 2, 2001, when the 3-month Treasury bill yield was 5.87% and the 10-year Treasury note yield was 4.92%, and the spread was -0.95%. The federal funds target rate and the CPI inflation rate stood at 6.50% and 3.72%.
A recession followed 30 months after the initial inversion, and 8 months after the extended inversion began, running from March 2001 and until November 2001. This was a relatively mild recession with peak unemployment reaching only 6.3% and GDP declining by only 0.3%. At the end of the recession the 3-month yield was 1.92% the 10-year yield, 4.79%, the spread 2.87%. The federal funds target rate equaled 2.00%, 4.00% below the level at the end of the last recession, and over the cycle CPI inflation rate dropped from 4.82% to 1.89%.
Cycle 3: May 13, 2004 through April 5, 2010
At the start of this period the yields for the 3-month and 10-year Treasuries was 1.00% and 4.85% resulting in a spread of 3.85%. The federal funds target rate was 1.00% and the CPI measure of inflation was 2.90%. By the mid-2000s inflation had largely been tamed, and except for a short uptick during the last recession it has remained low, which has complicated matters for monetary authorities.
On January 17, 2006, a relatively short 20 months later, a shallow and brief inversion occurred: the 3-month yield rose to 4.38% and the 10-year yield fell to 4.34%. There were 3 inversion days during January and 6 more in February. The extended period began on July 17, 2006, and by August 27, 2007 there had been 233 inversion days, or 57.4% of the period. The deepest inversion, on February 27, 2007, was -0.64%.
During those 13 months, the CPI fell from 4.1% to 1.9%, and the Fed left its target rate unchanged at 5.25%.
The recession that followed began in December 2007, 23 months after the initial inversion and 18 months after the beginning of the sustained period. As we all know, the Great Recession that extended until June 2009 was our worst economic downturn since the Great Depression: unemployment rose to 10.0% GDP shrank by 5.1%, and the misery indexes soared.
The Current Cycle: April 5, 2010 to Whenever
At the beginning of this period yields on the 3-month and 10-year Treasuries were 0.16% and 3.57%, and the spread, 3.41%. The first inversion took place on March 22, 2019, with 3-month Treasury bills at 2.46% and 10-years at 2.44%.
Over the 9 years & 11 months since the beginning of this cycle the upper range of the federal funds rate target rose from 0.25% to 2.50%, suggesting that the 3-month Treasury bill appears to have been pushed higher by Fed policy actions. Over the same period the yield on the 10-year Treasury note declined by 1.13%, and the CPI measure of inflation declined by 0.35% from 2.21% to 1.86%. Over this period the spread between the 10-year Treasury note and the 10-year TIPS (Treasury Inflation-Protected Security) declined from 2.35% to 1.91%, showing inflation expectations to be in check.
Summing Up
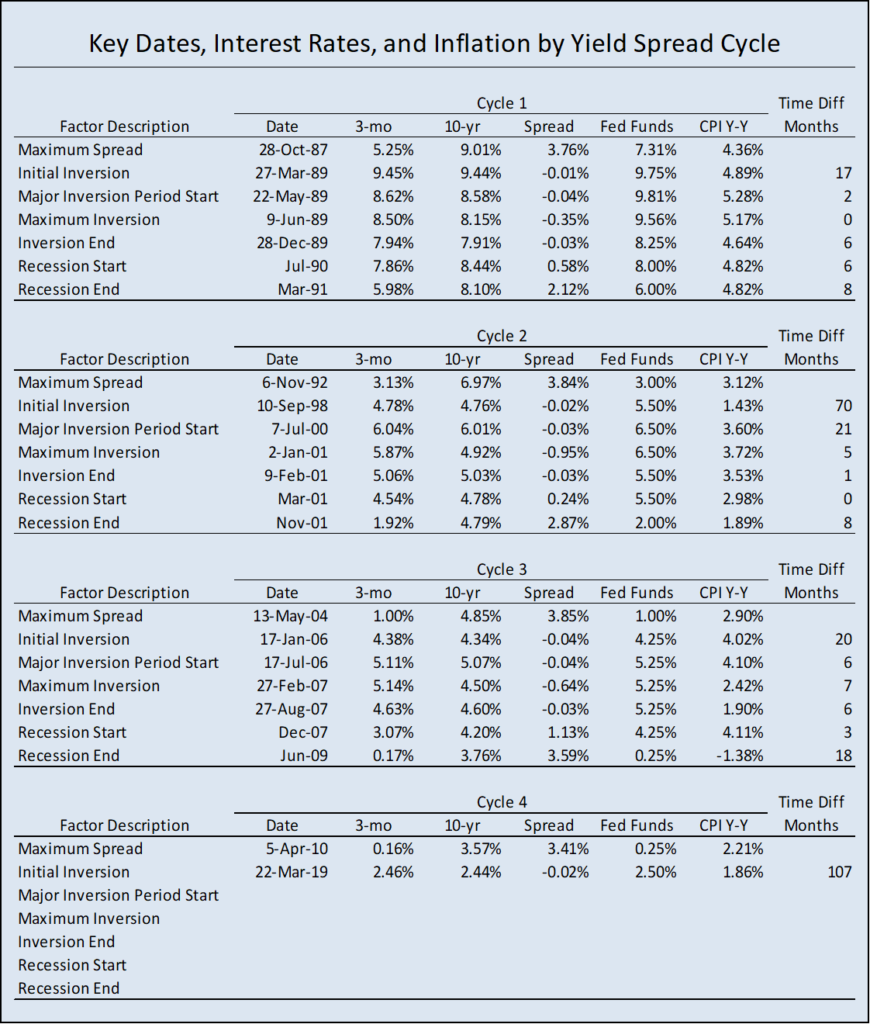
The following table provides a summary of key dates, yields, federal funds targets, and inflation rates for the past three economic cycles and for the beginning of the current cycle.
As the past three cycles have shown, a considerable amount of time may pass between the first inversion and the longer, sustained period. On May 1, the spread between the 3-month and 10-year Treasury yields was 0.10%.
Here are the take-aways:
• The peak values of the 3-month to 10-year Treasuries yield spread were tightly clustered between 3.76% and 3.85% at the start of the prior three yield spread cycles, but at the beginning of the current cycle the spread is somewhat lower at 3.41%.
• Federal Reserve Board increasing the federal funds target rate contributed to the shrinking of the yield spread during all three prior cycles, but this does not entirely explain the changes in 3-month Treasury bill yields. From the beginning of Cycle 1 until the first inversion the Fed funds rate target was up 2.44%, but the 3-month Treasury bill yield was up 4.20%. From the beginning of Cycle 2 until the first inversion, the Fed funds rate target rose by 2.50%, but the 3-month Treasury bill yield increased by only 1.65%. From the beginning of Cycle 3 until the first inversion the Fed funds target increased by 3.25% and the 3-month Treasury bill yield increased by 3.38%. For the current cycle the federal funds rate target increased by 2.25% and the 3-month Treasury bill yield increased by 2.30% from the cycle’s start until the initial inversion date.
• The nature of changes in the yields for the 10-year Treasury notes are mixed. From the time of peak yield spread until the first inversion the 10-year Treasury yield increased by 0.43% during Cycle 1, decreased by 2.21% during Cycle 2, decreased by 0.51% during Cycle 3, and decreased by 1.13% during the current cycle. For Cycles 1 and 3 and for the current cycle increases in the 3-month Treasury bill yield explain the majority of the collapse of the yield spread. But for Cycle 2, during the late 1990s and early 2000s, the decline of the 10-year Treasury note yield had the greater impact on the inversion of the yield spread.
• In addition, changes in the rate of inflation distinguish Cycles 1 and 3 from Cycle 2. During Cycle 1 the rate of inflation increased from 4.36% to 4.89% before the first inversion. For Cycle 3 the inflation rate rose 2.90% to 4.02% in the comparable period, but for Cycle 2 the rate of inflation decreased from 3.12% to 1.43%, a likely explanation for the drop in the 10-year Treasury note yield at the beginning of Cycle 2. During the current cycle inflation has also fallen, from 2.21% to 1.86%.
• For the prior three cycles the lapse between the initial inversion and the sustained inversion were 2 months, 21 months, and 6 months, and the lapse between the beginning of periods of sustained inversion and the start of the recessions were 13 months, 8 months, and 16 months.
Based on the analysis of the last three yield spread cycles, I would argue that long-term shrinkage of the 3-month to 10-year Treasuries yield spread indicates that the United States economy is headed for recession, with the obvious question, but when?, since lapses between initial inversions and the start of recessions has ranged from 15 to 30 months. And we are in uncharted territory.
I think Cycle 2, which extended from the mid-1990s to the early 2000s, is the most like the current one. That was a period of strong economic growth, low unemployment, and low and declining inflation. The bursting of the dot.com bubble put a major dent in that expansion, and although the 9/11 terrorist attacks were followed by declines in payroll employment, there was evidence at the beginning of September that such losses were coming.
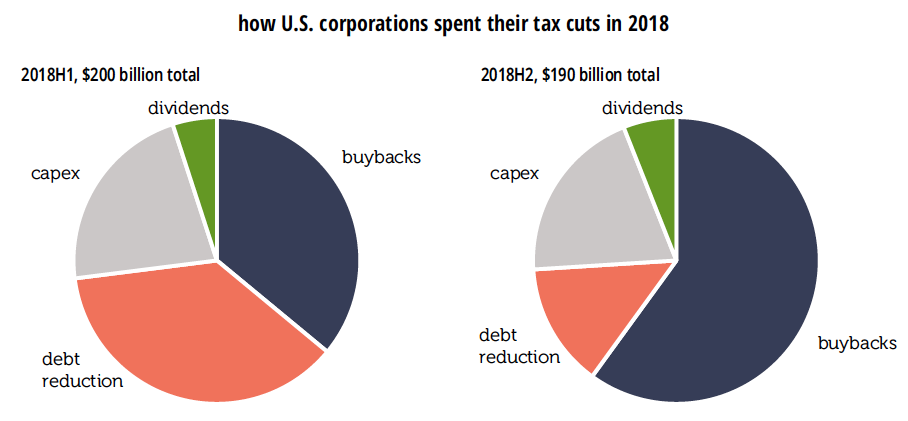
Now there is considerable economic froth generated by the federal tax cuts & the resulting explosion of the federal deficit: inflated equity prices as tax savings flow into stock buy backs and increased dividends; and a rush of new tech initial public offerings that is goosing stock markets exuberance, which is curious since many of the companies issuing stock have no profits. And we have a long list of political unknowns that could disrupt the economy: domestic political turmoil, a Brexit related economic slowdown in Europe, a possible revolution and proxy war in Venezuela, and deepening trade disputes. Maybe I’ll stop there.
To me a reasonable guess is that we have another year to 18 months before recession provided no major political shocks occur. If the Federal Reserve continues in a holding pattern there will be little pressure from below to push up the 3-month Treasury yield. This time there may actually be a higher probability of downward pressure on the yield spread with inflation in check and a variety of factors pushing prices lower. These include a stronger dollar due to weakening foreign economies, government budget tightening, and continued growth of domestic oil and natural gas production.
The best advice for now is to just be watchful. Keep an eye on the 3-month to 10-year Treasuries yield spread. When it falls into a period of sustained inversion there will still be many months until a recession sets in. This should provide alert businesses and households with adequate time to plan for and adjust to the coming economic slowdown.
Mike Lipsman


