Archive for December, 2018

Light truck detailing with an insider

In our mid-November report, we noted that auto-industry expert Kim Hill pointed out at a recent conference that automobiles’ share of total sales had dropped five percentage points over the year, and that the average price had risen 3% over that same period, because of light trucks. You can see that on the graph below, and also the, we’d say, shocking fact that light trucks were about 15% of total sales in 1970 and are close to 70% today. We’d like to give Kim a hat-tip for pointing out that within this trend auto jobs in nine states were at risk, with four plants in Michigan, six between the Great Lakes and the Gulf Coast in danger, and plants in California and Kansas possibly targeted.

As we heard from a small percentage of those plants, we picked up the phone, and Kim immediately cut to the chase, highlighting two trends. First, “One of the ugly parts of this industry transformation is that you have a bunch of older workers who just don’t have the skills they need for the future.” Them’s harsh terms about “cutting out dead wood,” so they can hire the tech-savvy younger workers, and we all agree that that is a public policy issue.
Kim says that General Motors has been looking at the plant in Ontario for a long time, and they are going to take some PR lumps for that because Canada and Ontario governments helped out GM during bankruptcy.

Here in the U.S. they are contractually obliged with unions to give long leads when they are closing plants, so don’t pencil these layoffs into your forecasts yet. Kim thought there would be more shuffling of workers, and was surprised to hear about the outright closings, although he knew the risk was there. He also suspects that the two plants being scrutinized, one in Ohio and one in Michigan, will be whipsawed against each other, and the states will get involved in a kind of bribing process with lots of money on the table. As sales of sedans “fall off the table,” these shifts to truck-style products will continue.

Auto manufacturing multipliers are always a subject for debate, if you go in for that kind of thing, and you could drive a SUV through the range here. The Bureau of Economic Analysis puts a 2.87 on the auto industry, meaning $1.87 in spending for every direct dollar, but Kim says there are big differences if you look at regions or the entire nation. Regionally he and his colleagues can tell “the minute they get off the freeway” if a plant is thriving or wilting. “In Fort Wayne there make a ton of pickup trucks and small businesses are thriving, but for the last 10 years in Lordstown there are more and more empty parking lots.”

The auto-industry’s rule of thumb is that you’re safe if you take a multiplier of 7, that means 6 jobs for every direct job, for the industry overall. On the state level, that may fall to 4 or 5 because you are not picking up work generated outside the limited region, and if you look at the national level you can get up to a 10 multiplier for assembly plants because then you are picking up all the small suppliers and service firms throughout the country.

Plants at risk include those in Lansing, Michigan, assembling Camaros and Cadillacs; in Lake, Orion assembling Sonic and Bolt; in Georgetown, Kentucky assembling all sedans; in Fairfax, Kansas, making Malibus; in Chattanooga assembling small utility vehicles—as well as the Alabama Hyundai plant, and the Mississippi Blue Springs/Tupelo Corolla plant. More to come and not as sweet as Tupelo honey.

Many have reported that tariffs are a driving force in these plant closings, but Kim isn’t so sure. He didn’t refute our suggestion that tariffs may have been a deciding factor in the decision to shift employees between plants and outright closings, but he said there is too much in flux: many assembly plants might be able to absorb a 10% tariff but would choke on a 25% tariff, and it’s impossible to expect anyone to make a “massive industrial decision” without that information. It’s also very hard for decision makers to deal with “whimsical buyers driven by fuel prices.” Customers can turn on a dime, but manufacturers can’t. We’ll be featuring intermittent interviews with Kim Hill, so expect one in a few months when the effects of tariffs become clearer.

by admin· · 0 comments · Employment & Productivity, TLR Wire

China Trade & Tariffs: First the goods

This is a dense post but there is a lot of data here and it’s worth knowing.

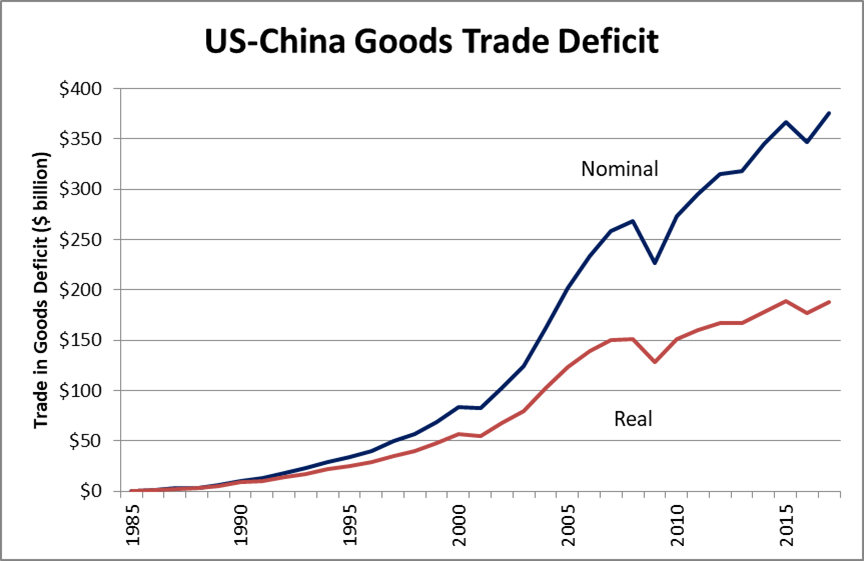
President Trump in his trade war with China has fixated narrowly on the U.S. – China imbalance between the export and import of goods between the two nations. The Census Bureau maintains a trade in goods by country dataset that includes import and export amounts in nominal dollars back to 1985. The chart below shows the trade in goods deficit with China from 1985 through 2017 in both nominal (blue) and real (red) dollars.

In 1985 the goods trade between the United States and China was about equal. By 2000, the nominal trade in goods deficit grew to $83.3 billion. From 1985 to 2000, U.S. goods exports to China rose from $3.9 billion to $16.2 billion, or by $12.3 billion (319.8%). Over the same period, U.S. goods imports from China increased from $3.9 billion to $100.0 billion, or by $96.1 billion (2,490.0%).

As large as the increase in Chinese exports to the United States was from 1985 to 2000, that growth has been eclipsed by the growth since 2001, when China was admitted to the World Trade Organization (WTO). From 2001 through 2017 Chinese goods exported to the United States jumped from $102.3 billion to $505.5 billion, or by $403.2 billion (394.2%). Over the same years U.S. goods exports to China grew from $19.2 billion to $129.9 billion, or by $110.7 billion (577.2%).

Over the entire period from 1985 through 2017 nominal goods exports from the U.S. to China grew by $126.0 billion (3,268.9%). Goods imports from China over this period grew by $501.6 billion (12,989.3%). The nominal value of the trade in goods deficit rose from $6.0 million in 1985 to $375.6 billion in 2017. Adjusted for inflation the trade in goods deficit in 2017 (in $1985) equaled $188.1 billion.
Although there has been a very large increase in the U.S. trade in goods deficit with China, the year-to-year change in the trade deficit has fluctuated a great deal. As shown in the following chart, the year-to-year changes appear to have stabilized and even decreased over the past seven years.

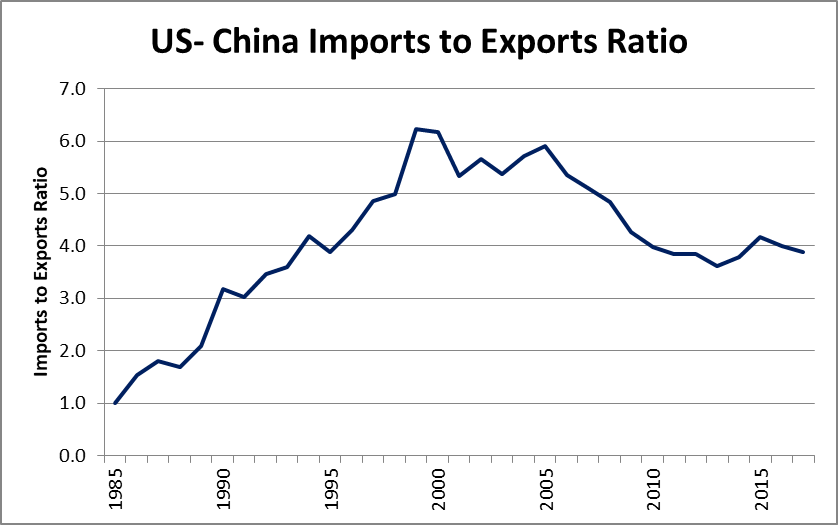
Another way of looking at the trade in goods relationship between the U.S. and China is the ratio of U.S. – China goods imports to exports. As shown below, this ratio hit a peak at 6.2 in 1999 and has moved lower since then. The ratio now stands at about 4.

Us china imports to exports ratio
So, what has happened since the trade war began earlier this year? First, it needs to be said that tariffs do not directly address the major complaints the United States has regarding Chinese trade practices. These complaints have to do with China’s failure to live up to free market reforms promised when it joined the WTO, expropriation of trade secrets from U.S. companies doing business in China, and industrial espionage. Thus, tariffs simply represent a warning shot and they may provide a means of getting China to address more substantive issues. In the mean time they are having disruptive effects on many U.S. businesses and they will likely cause price increases for many consumer goods. It has only been about six months since the first tariffs were announced, but trade and price statistics are starting to show some of the impacts.

The Bureau of Economic Analysis (BEA) issues quarterly bilateral trade reports. So far data exists only for the first two quarters of 2018. The following table shows year-to-year changes in U.S. – China exports, imports and trade balances for eight goods categories.

Year-to Year U.S. – China Goods Trade Changes, First and Second Quarter of 2018

In response to U.S. tariff increases, China has imposed reciprocating tariffs on a number of agricultural commodities. The BEA statistics do show a decline during both the first and second quarters in the value of food, feed and beverage exports. Even though the China tariffs on U.S. agricultural commodities did not take effect until the second quarter, it began stockpiling some commodities earlier in the year.

Soybean exports have been particularly hard hit. A recent American Farm Bureau report (October 23, 2018) indicated that during the first seven weeks of the 2018/2019 market year (September 1 through August 31) that soybean exports to China declined by 97 percent compared to the prior year. Since peaking on March 5th at $10.77 per bushel, the cash price for soybeans has dropped to $8.93 per bushel on November 30th, which equals a 17 percent decrease.

The BEA data also shows a decline in exports to China of autos, auto parts and engines. During June, July and August U.S. motor vehicle exports to China decreased by $506.3 million (50.3%), $296.2 million (46.7%), and $599.3 million (55.7%), respectively (Forbes, October 25, 2018). A third category of U.S. exports that has declined since the imposing of tariffs is consumer goods.

On the import side of the trade ledger, U.S. tariffs seem to be having the greatest impact on food, feed and beverages and on consumer goods. However, since most of the new U.S. tariffs on Chinese produced consumer goods only took effect in mid-September prices for items such as apparel, footwear, toys, computers, and other electronics have not yet been passed on to U.S. consumers. Where price impacts seem to be showing up are for goods, such as motor vehicle parts and for steel products. Since the tariffs on steel and aluminum were the first ones imposed back in March the prices of domestically produced goods with high steel or aluminum content have begun to increase. Examples of year-over-year price changes for selected goods are presented in the following table.

Year-over-Year Price Changes for Selected Consumer and Producer Goods, January – October 2018

Finally, the balance of trade for goods between the United States and China appears to show some impact of the tariffs. Although the trade in goods deficit with China increased during both the first and second quarters of 2018, the increase in the deficit during the second quarter was only about one-fifth of the size of the increase during the first quarter. The greatest change occurred in the consumer goods category. During the first quarter the U.S. consumer goods deficit with China grew by $6.1 billion, but during the second quarter the deficit shrank by $93 million. There was also a large change in the industrial supplies and materials category. During the first quarter the trade deficit with China in this category increased by $494 million, while during the second quarter the deficit declined by $854 million compared to the prior year.

Quarterly bilateral trade statistics for the third quarter will be released by the BEA in mid-December. These should provide a clearer picture of the impact of tariffs on the trade in goods flows between the United States and China.

Next the services….

by admin· · 0 comments · Uncategorized