All about Jobs, 4: Should the Quit Rate Be Higher?
As this graph shows, the private sector quit rate is close to an all-time high for the series. Quits are a sign of worker confidence and can forecast wage pressures ahead. But as high as the quit rate looks, should it maybe be higher?
To answer that question, it’d be nice to have a quit series that goes back before 2001. We don’t have an official one of those, but we can construct one by using the share of voluntary leavers among the unemployed and those unemployed five weeks or less. For the period since 2001, the synthetic quit rate has an r2 of 0.93 relative to the actual rate.
Of course, things may have changed over time, but r2’s like that are rare in the world of economics, so we feel pretty confident that this is a good estimate of the pre-2001 history.
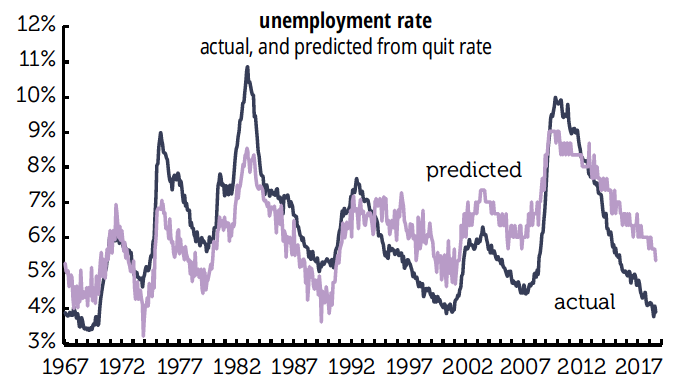
And if we take that long-term synthetic series and compare it to the unemployment rate, we get the results graphed above. Instead of the July unemployment rate of 3.9%, the predicted rate should be considerably higher, 5.3%. In other words, workers are acting as if the jobless rate is almost a point-and-a-half higher than it is. Note that the pattern was similar around previous unemployment troughs in 2000 and 2007.
But before 2000 the reverse was true, as the predicted rate was higher than the actual. We suspect what’s at work is a phenomenon that Alan Greenspan used to talk about in the late 1990s: the fear of corporate restructuring and job skill obsolescence that took hold in the late 1980s/early 1990s has changed worker psychology. It takes a lower unemployment rate to give rise to enough confidence to quit than it did several decades ago.
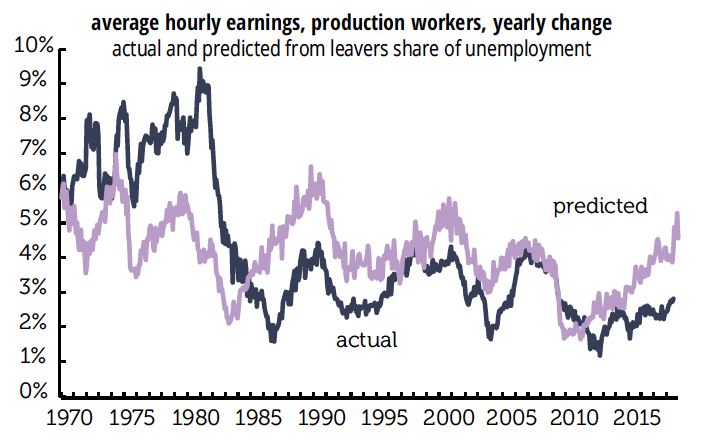
And finally, All about Jobs, 5: What about job leavers and wages?


