Archive for September, 2018

Earth to Kevin Hassett: If you use that wrench…

The other day, Kevin Hassett, chair of the Council of Economic Advisers, dismissed concerns about slow wage growth by saying that if you deflated average hourly earnings (AHE) by the index for personal consumption expenditures (PCE) rather than the consumer price index (CPI) earnings look a lot better over the last year. And, he added, it’s a mistake to look only at direct pay because a lot of raises are going into benefits. There are two problems with his argument: first, AHE have looked a lot better if you deflate them by PCE for most of the last three decades, and for second, benefits are running only slightly ahead of wages in the private sector, and rather behind overall.

Here’s a comparison of yearly changes in the two inflation measures. In 88% of the months since 1990, the CPI came in above the PCE.

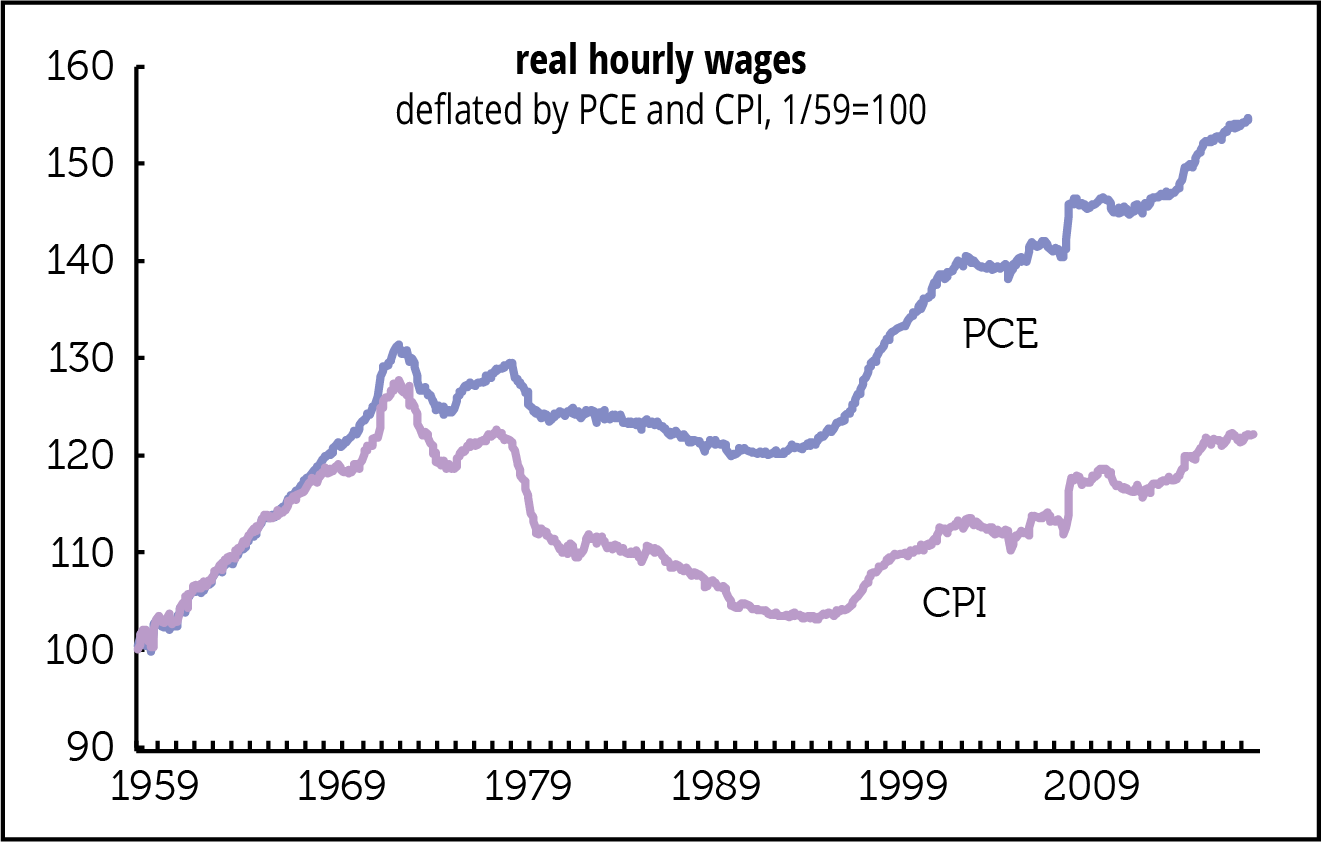
And here’s what AHE look like when you deflate them by the two measures. Since the all-private series only begins in 1964, and the all-worker series in 2006, we’ve chained nominal wages from those two series together with manufacturing (which go back to 1939) to produce a long-term measure. Using the CPI, real wages are 4% below their 1973 peak; using the PCE, they’re 18% above. We’ll leave the topic of which is the better measure for some other time. But any recent outperformance of real wages using the PCE rather than the PCI is a very old story.

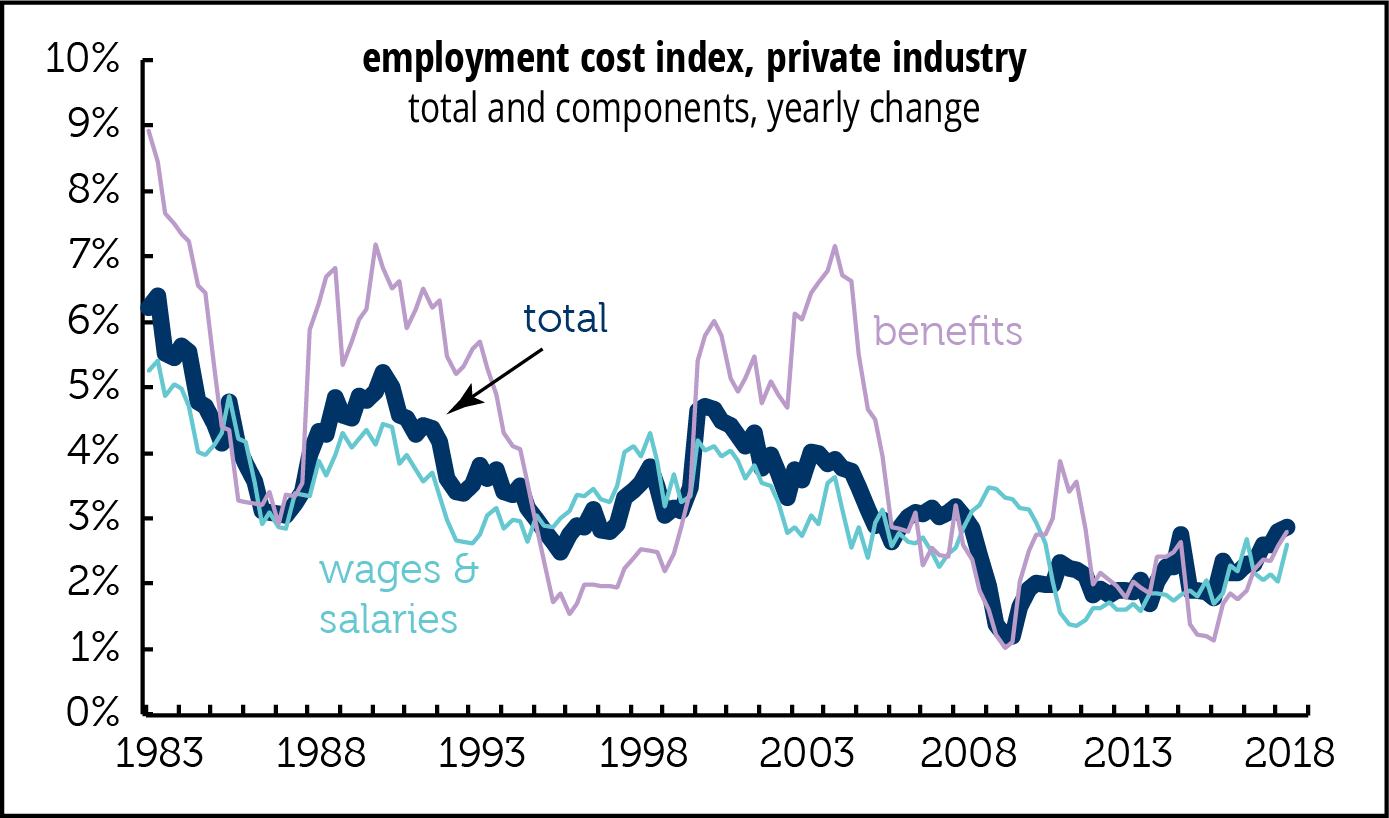
Finally, benefits aren’t doing that great. Here’s the history from the Employment Cost Index (ECI) series. Overall compensation growth in the second quarter was at the high for the cycle—but it’s below early troughs, like 1987, 1995, and 2006. Benefit growth is only slightly above wage growth, and is nothing compared to the bulges seen from 1988–1993 and 2000–2005. A major reason for this is the deceleration in health costs. Employers’ health costs were up just 1.5% for the year ending in 2018Q2, a third the 2010 average of 4.8%, and less than a fifth the 2000–2006 average of 8.2%. Health insurance costs are now lagging overall medical inflation; they exceeded it in the early periods by a wide margin. That suggests employers are shifting more costs to employees.

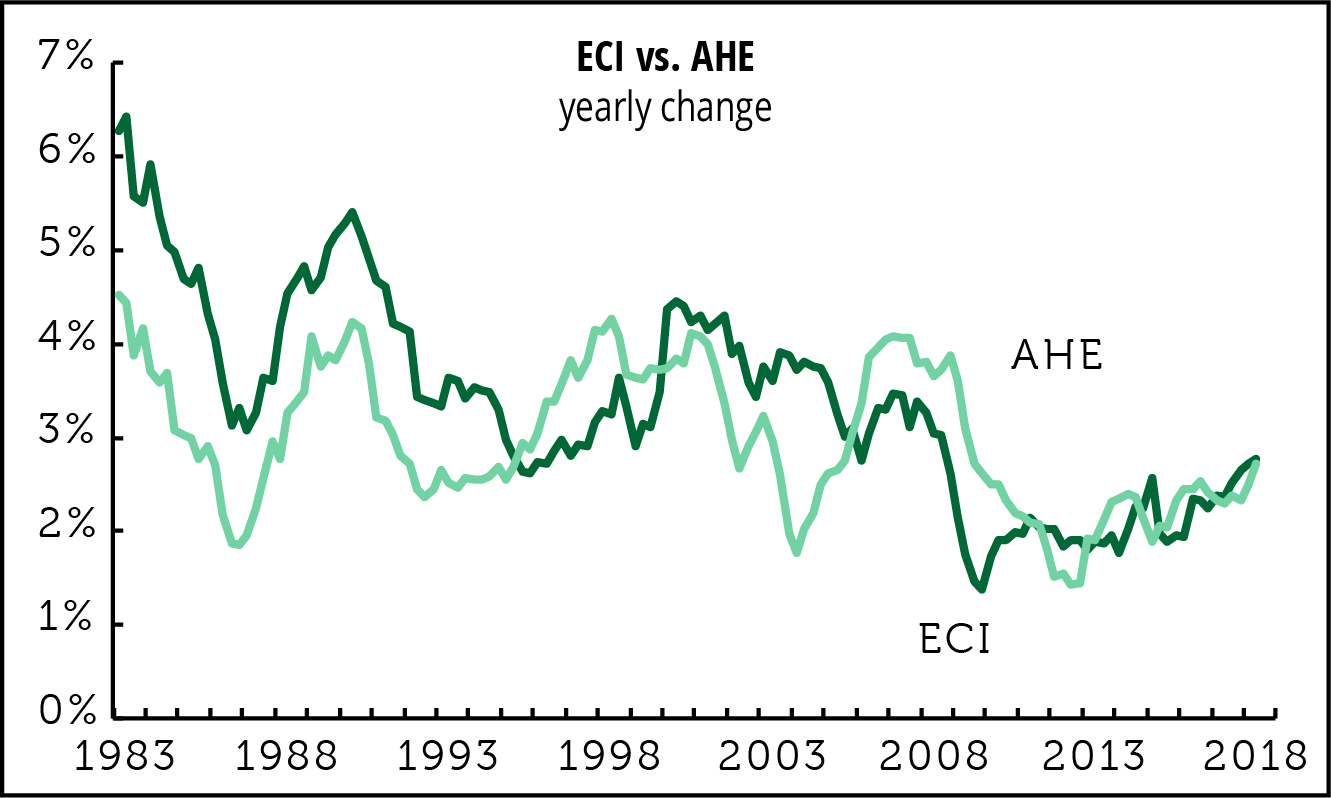
By the way, here’s what the ECI looks like compared to AHE. We don’t recommend making a habit of using the ECI as “truth.” When we asked an economist at the Bureau of Labor Statistics some years ago what he thought of substituting the ECI for AHE, he said, “If you use that wrench, you’re going to strip that bolt.” Kevin Hassett may need to visit his favorite hardware store.

by admin· · 0 comments · Employment & Productivity, TLR Wire

State E&E = Job & Wage Growth Often Go Together

How have the states been doing on jobs and pay since the last business cycle peak? We’ve mapped some answers.

First E1, Employment: Between the last business cycle peak in December 2007 and July 2018, the most recent month available, the median state has seen a 5.3% increase in employment. At the top of the list is Utah, up 20.1%, with North Dakota and Texas close behind. Some of the bigger, richer states have done well, like California (up 10.8%) and New York (10.0%). So has Massachusetts, up 10.9%, a state that’s not thought of as a boomy place. At the bottom: Wyoming (-2.6%), West Virginia, (-1.1%) New Mexico (-0.8%), and Connecticut (-0.5%), who’ve all lost jobs over the last decade-plus. Also weak: Mississippi (+0.3%), Alabama (also +0.3%), Maine (+1.3%), Louisiana (+2.7%), and New Jersey (+2.8%). Of the ten states with the largest energy sectors, five (Louisiana, Alaska, New Mexico, West Virginia, and Wyoming) are clustered in the bottom quarter, and a sixth, Oklahoma, is at the median. Two are closer to the top, Texas and Colorado, but they’re generally more diversified economies than the ones at the bottom.

It’s interesting that while New York has done rather well, two of its neighboring states, Connecticut and New Jersey, haven’t. New York City accounted for 79% of the state’s employment gain over the period, nearly twice its share of the state job market. Were New York City a state, it would rank fifth in employment gains; New York State excluding the city would rank in the bottom third. This is a reversal of the trend of earlier decades when the urban core lagged its suburbs. For example, between 1990 and 2000, New York City’s employment gains were less than half that of the state outside the city.

Second E2, Earnings: There’s a huge variation in growth in average hourly earnings (AHE). At the top of the list, North Dakota, up 42.9% between December 2007 and July 2018. Since it ranked second in employment growth, its workers have done very well, a reflection of the fracking boom. South Dakota is in second place, up 38.9%; Oklahoma, third (34.7%); and Iowa, fourth (32.9%).

Four of the top ten states—South Dakota, Oklahoma, Montana, and West Virginia—are among the ten most energy-intensive. But other energy states did less well, with Texas (22.6%) just below the median of 23.9%, and Colorado (22.5%), Wyoming (21.7%), and Louisiana (also 21.7%) not far behind. California (25.0%) and New York (22.5%) are around the median. (There’s not much difference between New York City and State on earnings; the city’s AHE were up 24.7%.) Florida, Michigan, New Jersey, and Connecticut are all towards the bottom.

Texas is an interesting case. While it’s often touted as a jobs mecca, it’s not notable for high pay. That’s not to say that keeping pay down is necessarily good for employment. The correlation coefficient between employment and earnings growth between 2007 and 2018 is 0.37—not super-high, but still solidly positive. Job and wage growth often go together.

by admin· · 0 comments · Employment & Productivity

All About Jobs, 1: Five Uneasy Pieces

Alan Greenspan used to say that the fears concerning skill obsolescence & the corporate restructuring that took hold in the 1980s & 1990s had changed worker psychology. In this series we examine 5 pieces of underlying evidence.

First up: Job Openings

In the most recent Job Openings and Labor Turnover Survey (JOLTS) data, for July, job openings and hires were mostly unchanged from June, though manufacturing showed a nice uptick in both, as did accommodations and food services. Separations were little changed.

Monthly changes can be distracting, so here’s a longer look at the openings component. At 4.7% of employment in July, private sector openings are at the high for the series, and July’s high matches April and June’s. The high before these recent numbers was the 4.2% in January 2001, as the late-1990s boom was unwinding, all visible on this graph.

Openings look great, but what do they really mean? Well, for that, please see All About Jobs, 2: Should the unemployment rate actually be lower?

by admin· · 0 comments · Employment & Productivity

All about Jobs, 2: Should the Unemployment Rate Actually Be Lower?

There are now just 0.91 unemployed people per opening, compared to 1.12 in January 2001. Or, as the graph below shows if the relationship between the openings rate and unemployment rate that prevailed before the Great Recession were still in place, the unemployment rate “should” be well under 2%, less than half its current rate.

And that means? On to All about Jobs, 3: Phantom Job Openings, evidence from HWOL

by admin· · 0 comments · Employment & Productivity

All about Jobs, 3: Phantom Job Openings: Evidence from HWOL

We suspect that these are phantom job openings, a kind of tire-kicker index in which employers are hoping to land a really big fish, but not using very good bait.

Looking at the Conference Board’s help wanted online (HWOL) series underscores the possibility that employers may not be that serious about these openings.

Both versions of the HWOL series, new, unduplicated listings and total listings—have been trending downward for three years, while the openings rate has been working its way higher. If employers want to fill these jobs, why aren’t they advertising them? We first asked this question in October 2016 and last asked it in May, and the trends have only di-verged further with each asking.

Anything else? Yes! All about Jobs, 4: Should the quit rate be higher?

by admin· · 0 comments · Employment & Productivity