With trade & tariffs much in the news, Colin J. Hoffman & Ryan Monarch, both in the International Finance Division of the Fed’s Board of Governors, just released the paper “Distributional Consequences of Trade for U.S. Consumers: Estimating Group-Specific Import Price Inflation.”
They work to shift the focus from the effects of international trade on different groups of workers to different groups of consumers, and want to know if changes in prices driven by increased international integration exacerbate or ameliorate real income inequality, driven by nominal income changes.
The authors reference a 2016 paper, “Measuring the Unequal Gains from Trade,” in which Pablo D. Fajgelbaum & Amit K. Khandelwal (of UCLA and Columbia) review the effects of import price disparity on high- and low-income consumers. Their scenario involves closing down trade, which is extreme and we don’t expect, but their work is still worth a look. Using the elasticity of imports, incorporating both trade costs and income, they find that such a closing off of trade would be about twice as hard on lower income groups than on the top decile: lower-income consumers spend more on traded goods, with lower elasticities, whereas higher income groups spend more on services. This bias extends around the world, but in countries with lower elasticity of exports, fewer gains would accrue to the poor from opening trade.
Hoffman and Monarch find that low- and high-income groups have about the same share of expenditures on imports, and both have increased to about 10% as of 2014 from around 7% in 1998. However, the 1st decile’s share of imports excluding food and fuel is about 70%. That share falls to about 66% for the second decile, and then rises through the deciles to 77% for the top. But all goods are not equal. Those much disparaged washing machines are about 1.8% of expenditures for the lowest decile, steadily falling to just 0.8% for the highest, whereas spending on imported sporting goods rises from about 0.5% for the lowest to 2.2% for the highest decile.
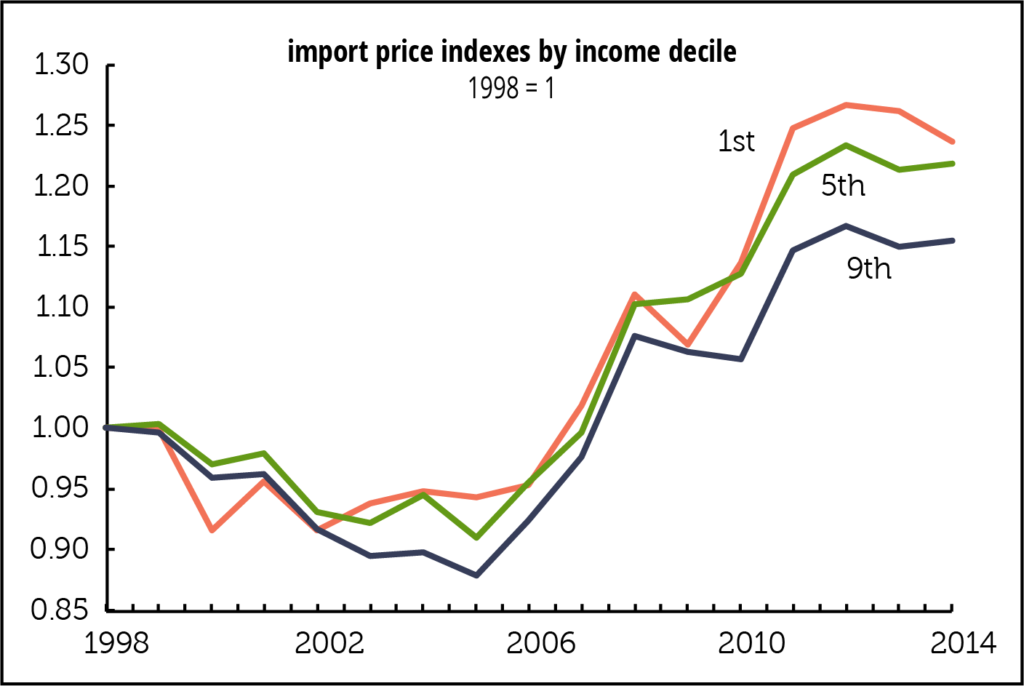
We can see where this is going. Although inflation in imported goods has risen for all groups, the lower income groups have faced higher inflation in import prices. Using prices for 228 Harmonized Commodity Description and Coding System sectors—let’s stick with HS—the authors find statistically significant differences in price changes across income groups. As the graph on p. 2 shows, import inflation was up 24% for the first decile, and 15% for the ninth.
And China held yearly changes in import inflation down for all deciles. Without China, yearly import inflation would have been up an additional 0.5–0.6 percentage points.
Since the method used to produce the results allows the authors to see different expenditure shares of the deciles within the same sector, and different expenditure shares across product varieties, the authors were able to demonstrate that taking out cross-sector differences aligns yearly increases for all deciles at 1%. That indicates to the authors that high-income consumers gravitated to sectors with lower inflation, and leads them to conclude that nominal income inequality that has risen owing to trade in the last decades, was not mitigated by changes in import prices across income groups. This is pretty specific information, but it underscores how much more specific the debate should be.


Trade: it’s complicated
With trade & tariffs much in the news, Colin J. Hoffman & Ryan Monarch, both in the International Finance Division of the Fed’s Board of Governors, just released the paper “Distributional Consequences of Trade for U.S. Consumers: Estimating Group-Specific Import Price Inflation.”
They work to shift the focus from the effects of international trade on different groups of workers to different groups of consumers, and want to know if changes in prices driven by increased international integration exacerbate or ameliorate real income inequality, driven by nominal income changes.
The authors reference a 2016 paper, “Measuring the Unequal Gains from Trade,” in which Pablo D. Fajgelbaum & Amit K. Khandelwal (of UCLA and Columbia) review the effects of import price disparity on high- and low-income consumers. Their scenario involves closing down trade, which is extreme and we don’t expect, but their work is still worth a look. Using the elasticity of imports, incorporating both trade costs and income, they find that such a closing off of trade would be about twice as hard on lower income groups than on the top decile: lower-income consumers spend more on traded goods, with lower elasticities, whereas higher income groups spend more on services. This bias extends around the world, but in countries with lower elasticity of exports, fewer gains would accrue to the poor from opening trade.
Hoffman and Monarch find that low- and high-income groups have about the same share of expenditures on imports, and both have increased to about 10% as of 2014 from around 7% in 1998. However, the 1st decile’s share of imports excluding food and fuel is about 70%. That share falls to about 66% for the second decile, and then rises through the deciles to 77% for the top. But all goods are not equal. Those much disparaged washing machines are about 1.8% of expenditures for the lowest decile, steadily falling to just 0.8% for the highest, whereas spending on imported sporting goods rises from about 0.5% for the lowest to 2.2% for the highest decile.
We can see where this is going. Although inflation in imported goods has risen for all groups, the lower income groups have faced higher inflation in import prices. Using prices for 228 Harmonized Commodity Description and Coding System sectors—let’s stick with HS—the authors find statistically significant differences in price changes across income groups. As the graph on p. 2 shows, import inflation was up 24% for the first decile, and 15% for the ninth.
And China held yearly changes in import inflation down for all deciles. Without China, yearly import inflation would have been up an additional 0.5–0.6 percentage points.
Since the method used to produce the results allows the authors to see different expenditure shares of the deciles within the same sector, and different expenditure shares across product varieties, the authors were able to demonstrate that taking out cross-sector differences aligns yearly increases for all deciles at 1%. That indicates to the authors that high-income consumers gravitated to sectors with lower inflation, and leads them to conclude that nominal income inequality that has risen owing to trade in the last decades, was not mitigated by changes in import prices across income groups. This is pretty specific information, but it underscores how much more specific the debate should be.