Archive for October, 2017
Fact Checking with James Bullard
Saint Louis Fed President James Bullard has been speaking out a lot recently. He recently proposed a new interest rate regime that, instead of focusing on models, uses a very intuitive decision tree to determine if raising rates is appropriate. He gave a speech at the end of last week that asked three questions: would the US see GDP growth greater than 2% in the coming year, would inflation hit the Fed’s 2% inflation target and would wages increase as unemployment decreases. His answer to all three was, “Probably not.” And in a break from tradition, he relies on incoming data rather than models to support his conclusions.
Bullard first observes that U.S. growth since the end of the great recession has converged to 2%. The following graph illustrates his point:
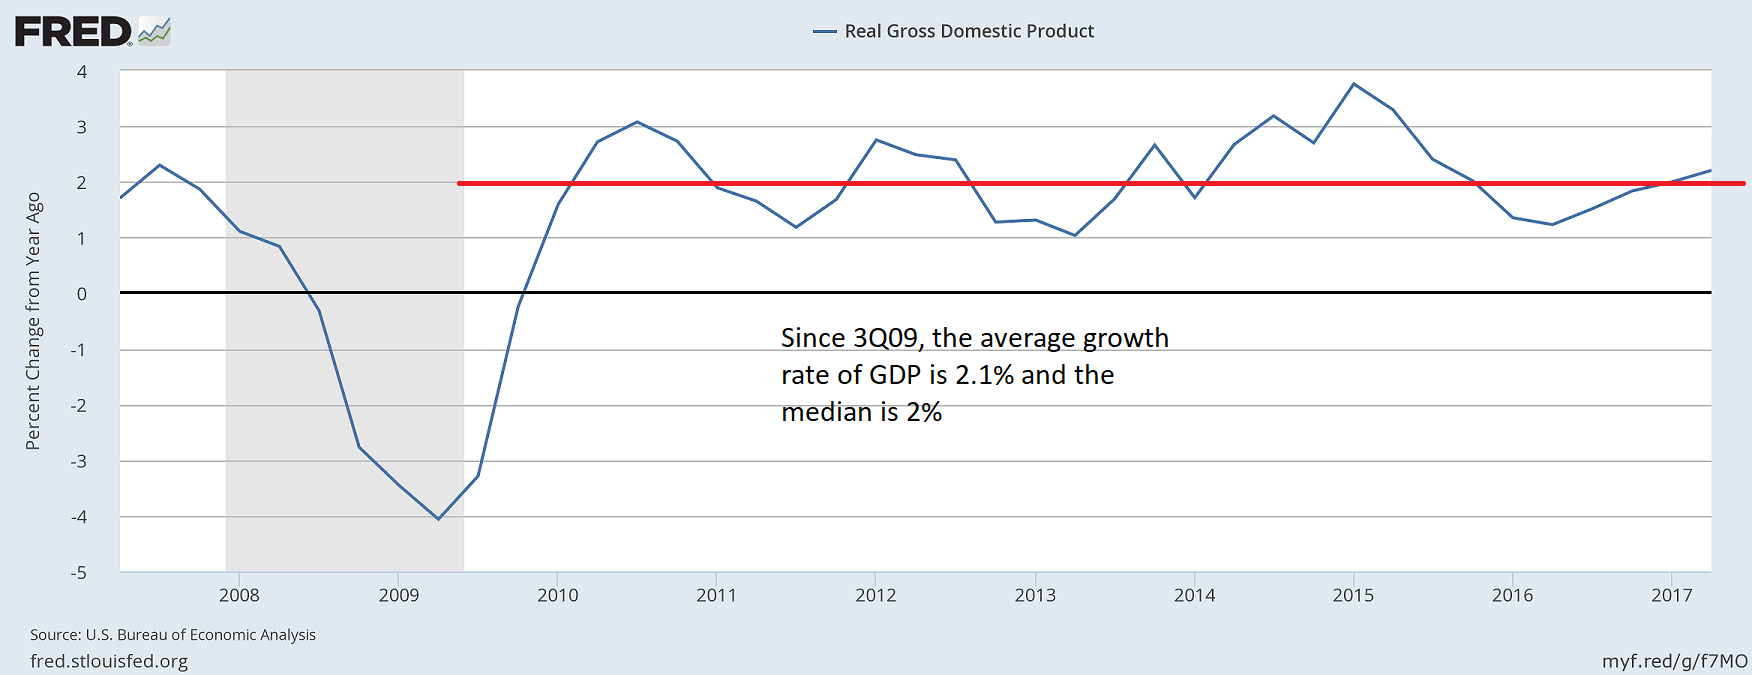
Since the third quarter of 2009, the average Y/Y growth rate has been 2.1% while the median growth rate has been 2%. There is little reason to project anything but moderate growth in the third quarter. Industrial production and real retail sales have both slowed. The three-month average payroll job growth is 185,000 per month -a solid rate but not one that warrants robust growth projections. Real income excluding transfer payments continues to increase but at a slower rate. The New York Fed’s Nowcast for third quarter GDP growth is 1.46% while the Atlanta Fed is calling for 2.8% growth The average of these two projections is 2.1%, which happens to be the approximate average of the blue chip forecasting consensus. The preceding information supports Bullard’s argument that there is a low probability of anything but more moderate growth.
Bullard moves on to inflation, arguing that it is doubtful that inflation, as measured by the personal consumption expenditure price index, will broach the Feds 2% target. The following data supports his conclusion:
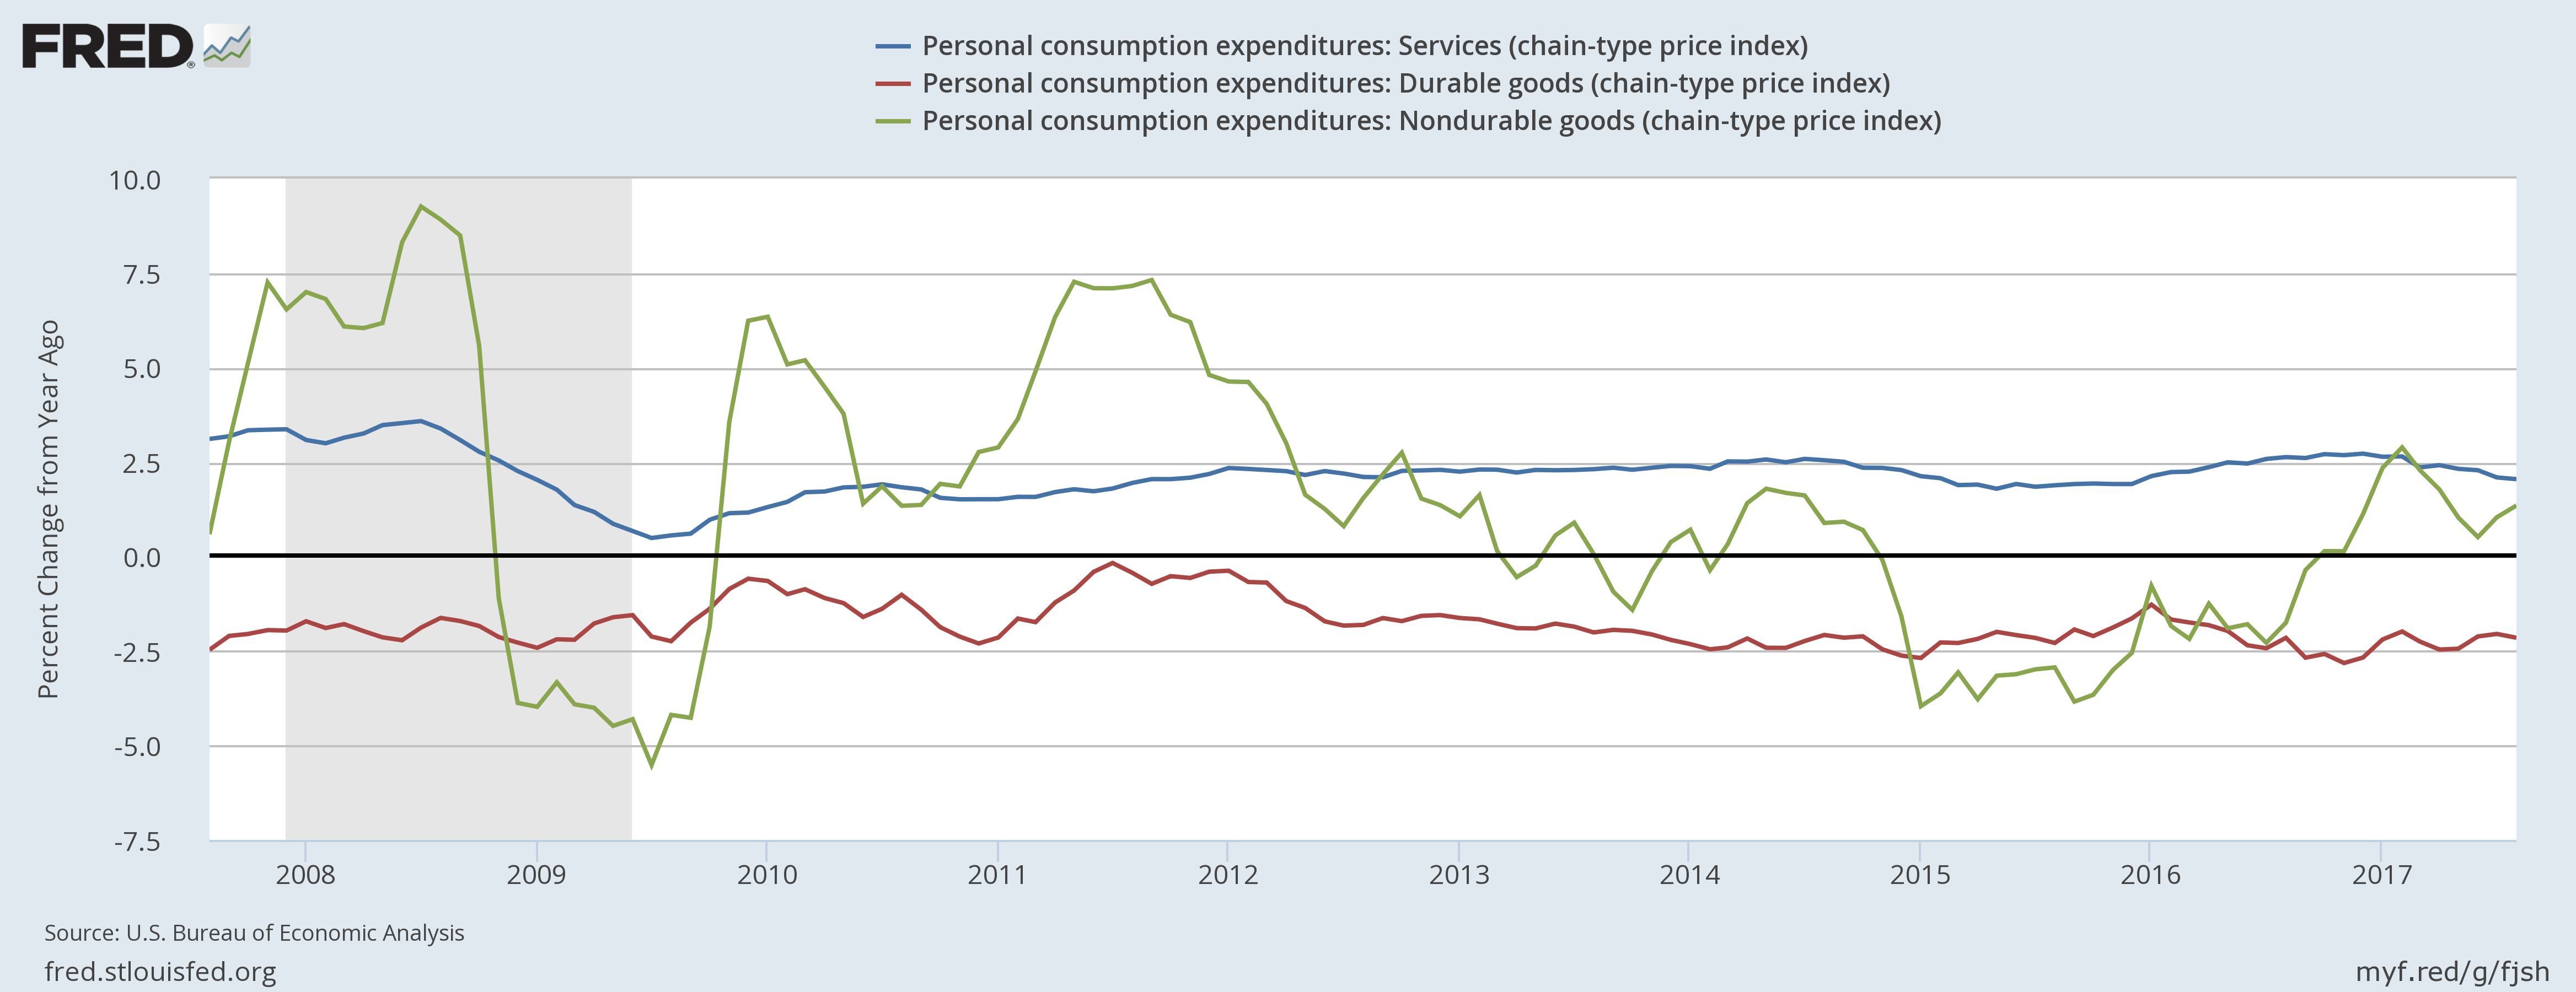
The BEA breaks PCE price data into three components: services, and durable and non-durable goods. Durable prices (in red, 10% of the index) have been subtracting from price pressures for the last 10 years. And their negative impact is pretty high: these prices have been contracting around 2% for the last year. Non-durable prices (in green, 20% of the index) are weak; they subtracted from inflation for all of 2015 and most of 2016, only recently adding any upward pressure. Their latest reading was for a 1.3% year-over-year rate of growth—hardly anything to be concerned about. That leaves services (in red, 70% of the index) to create all the upward pressure that the Fed needs for PCE inflation to hit 2%. Statistically, that’s very difficult to do.
Several Fed governors have advanced different theories to explain why inflation is so weak. Some have argued that global supply chains allow producers to purchase products from low-cost areas, keeping internal price pressures low. Others have argued that real-time access to price information allows consumers to buy at the lowest cost, which continually squeezes retailers’ margins. Another theory states that an aging population—such as that in Japan, the EU, and the United States—spends less, leading to lower demand, which translates into less demand-pull price pressures. Also consider that commodity prices are weak across the board, keeping input price pressures at bay. The real answer probably encompasses pieces of all these theories along with others that haven’t been considered yet. But regardless of the cause, it’s difficult to see why people continue to assert that inflation will return to 2% in the intermediate term. The data simply do not support that conclusion.
Bullard final point is that the Phillips curve is exceedingly flat. He offers the following table culled from academic research:
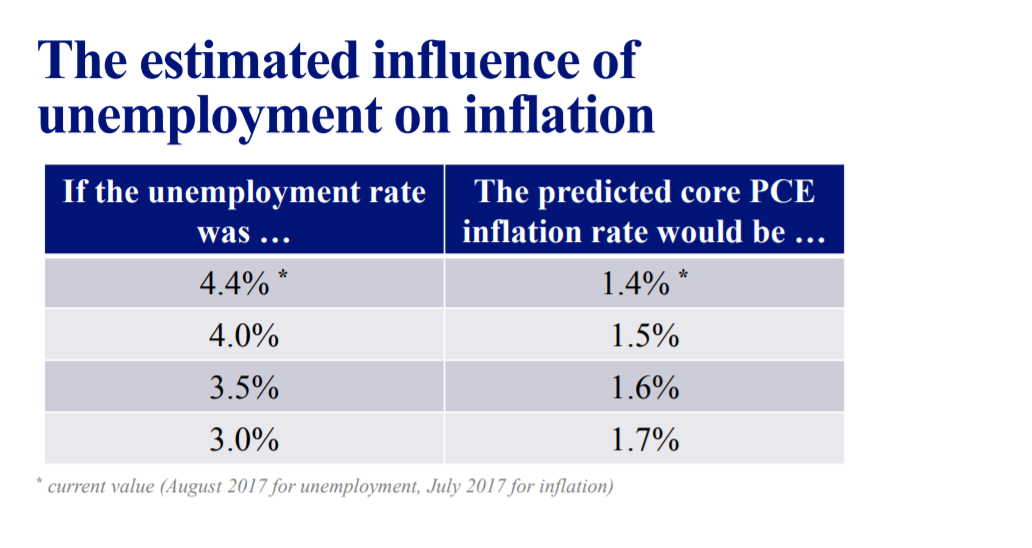
Clearly the unemployment rate/inflation rate relationship has weakened a lot. Minnesota Fed President Neel Kashkari, who was again the lone dissenter on June’s rate increase, offers the most logical explanation of this disengagement. To get around retirement issues and the like, he considers prime-age workers, and notes that their participation rate and employment/population ratio indicate there is more slack in the labor market than before the crash, and therefore there is room for improvement
Diesel Fuel Details
The big story during August and September was Hurricane Harvey. At its worst, Harvey knocked about 20% of U.S. refining capacity knocked offline. As a result the average price of regular gasoline jumped by 34-cents per gallon (15%) between the end of July to the week of September 11th, when it peaked at $2.61 per gallon. The price of diesel increased also rose by 27-cents per gallon (10.7%).
Crude oil prices actually fell as the storm hit Houston. During August the WTI price dropped from $50.21 per bbl to $45.96 per bbl. But since the beginning of September the WTI price has recovered, hitting $49.88 on the 18th. Going along with the crude oil price fluctuations, the U.S. crude oil inventory dropped by 19.8 million barrels (1.7%) during August, but risen since the beginning of September by 11.6 million barrels.
During August the price of Brent crude rose slightly from $51.99 to $52.69 per bbl. Data on domestic oil production and imports are only available through June. That month domestic producers accounted for 53.2% of the U.S. oil supply, and domestic production averaged 9.1 bbl per day. Shale oil accounted for 52.5% of domestic production.
Turning to domestic motor fuel consumption, for which the most current data is from last April, gasoline consumption totaled 12.0 billion gallons, up 206.5 million gallons (1.7%) from the prior April. This is a notable increase&mdashover the most recent three months gasoline consumption had declined by 0.2%.
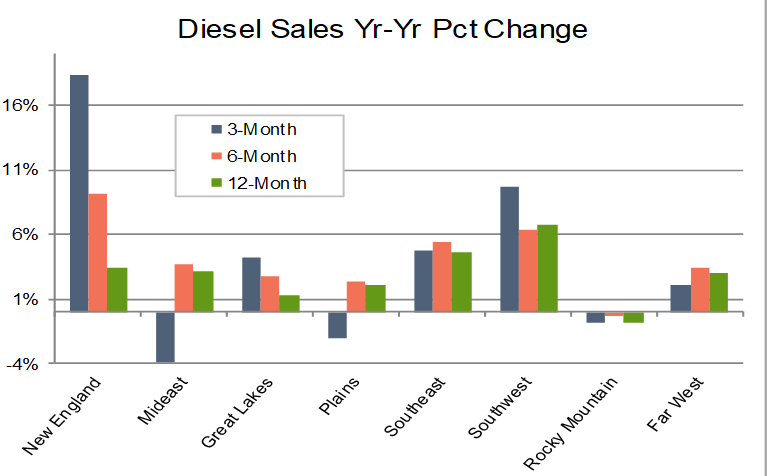
Diesel fuel consumption in April totaled 3.4 billion gallons, up 153.2 million gallons (4.7%) from April 2016. During the prior 3-, 6- and 12-month diesel fuel consumption grew by 3.7%, 4.3% and 3.6%, compared to the same periods in the prior year.
Regionally, over the three months from February&mdashApril the strongest growth occurred in New England states (18.3%) followed by the Southwest states (9.7%). States in the Southeast, Great Lakes and Far West regions also experienced some growth, but below 5.0% in all cases. The greatest decline occurred in the Mideast states (-3.9%). Other regions where diesel fuel consumption decreased included the Plains (-2.0%) and the Rocky Mountains (-0.8%). The states of the Rocky Mountain region have experienced year-over-year declines during the most recent 3-, 6- and 12-month periods.
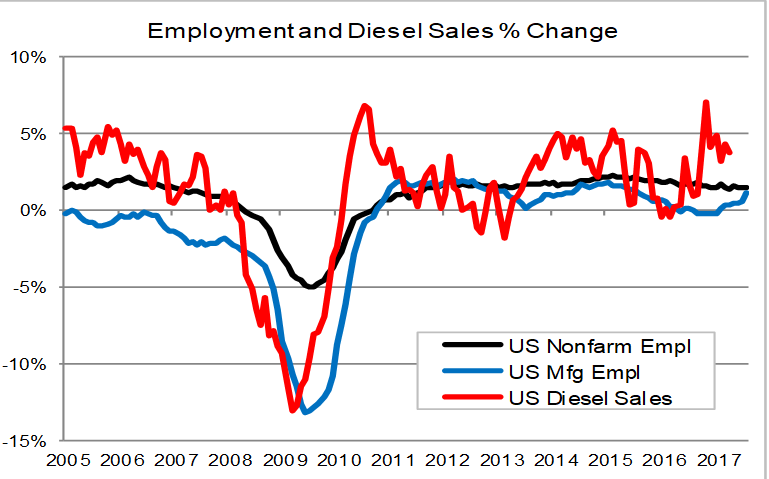
As shown on the above graph, the relationship between the 3-month moving average of diesel fuel sales and manufacturing employment continues to hold. However, the number of months by which changes in the diesel series leads the manufacturing employment series does fluctuate. The diesel series started becoming increasingly positive in March 2016, while the growth rate for manufacturing employment stayed negative until February 2017. Manufacturing employment growth has stayed positive and has continued to increase over the past seven months with a large jump from July (0.6%) to August (1.1%). If the relationship continues to hold, the year-over-year manufacturing employment growth rate will likely level off at about 1.3% for the remainder of 2017.
Subscriptions
No ideology, no agenda, just a straight take on breaking economic data.
Each week as we scrutinize incoming data, we will send you a graph and a concise note on anything new that’s worth your time, 4 – 5 times a week. Our perspective allows you to make intelligent decisions no matter what political or economic outlook you embrace.
Subscribe for $27 a month > More Info...
Subscribe >
More Info...
Subscribe >
 More Info...
Subscribe >
More Info...
Subscribe >