The Fed: Climate Change Ahead?
My formative years stretched from the mid-1970s to mid-1980s. While my economic awareness of the time was at best weak, I do remember that inflation was a very important issue that was constantly on my father’s mind. In case you’re wondering, the “I” in this piece is Hale Stewart.
It’s also obvious that this period haunts today’s central bankers as they continue to worry about inflationary pressures despite all evidence to the contrary. But the latest minutes—which were released on Wednesday—show a Fed that is beginning to realize some of them just may have it wrong.
Let’s start with their observations about the current state of inflation:
Total U.S. consumer prices, as measured by the PCE price index, increased 1-1/2 percent over the 12 months ending in May. Core PCE price inflation was also 1-1/2 percent over that same period. Over the 12 months ending in June, the consumer price index (CPI) rose 1-1/2 percent, while core CPI inflation was 1-3/4 percent. The median of inflation expectations over the next 5 to 10 years from the Michigan survey edged up both in June and in the preliminary reading for July. Other measures of longer‑run inflation expectations were generally little changed, on balance, in recent months, although those from the Desk’s Survey of Primary Dealers and Survey of Market Participants had ticked down recently.
Let’s put that into quantitative perspective:
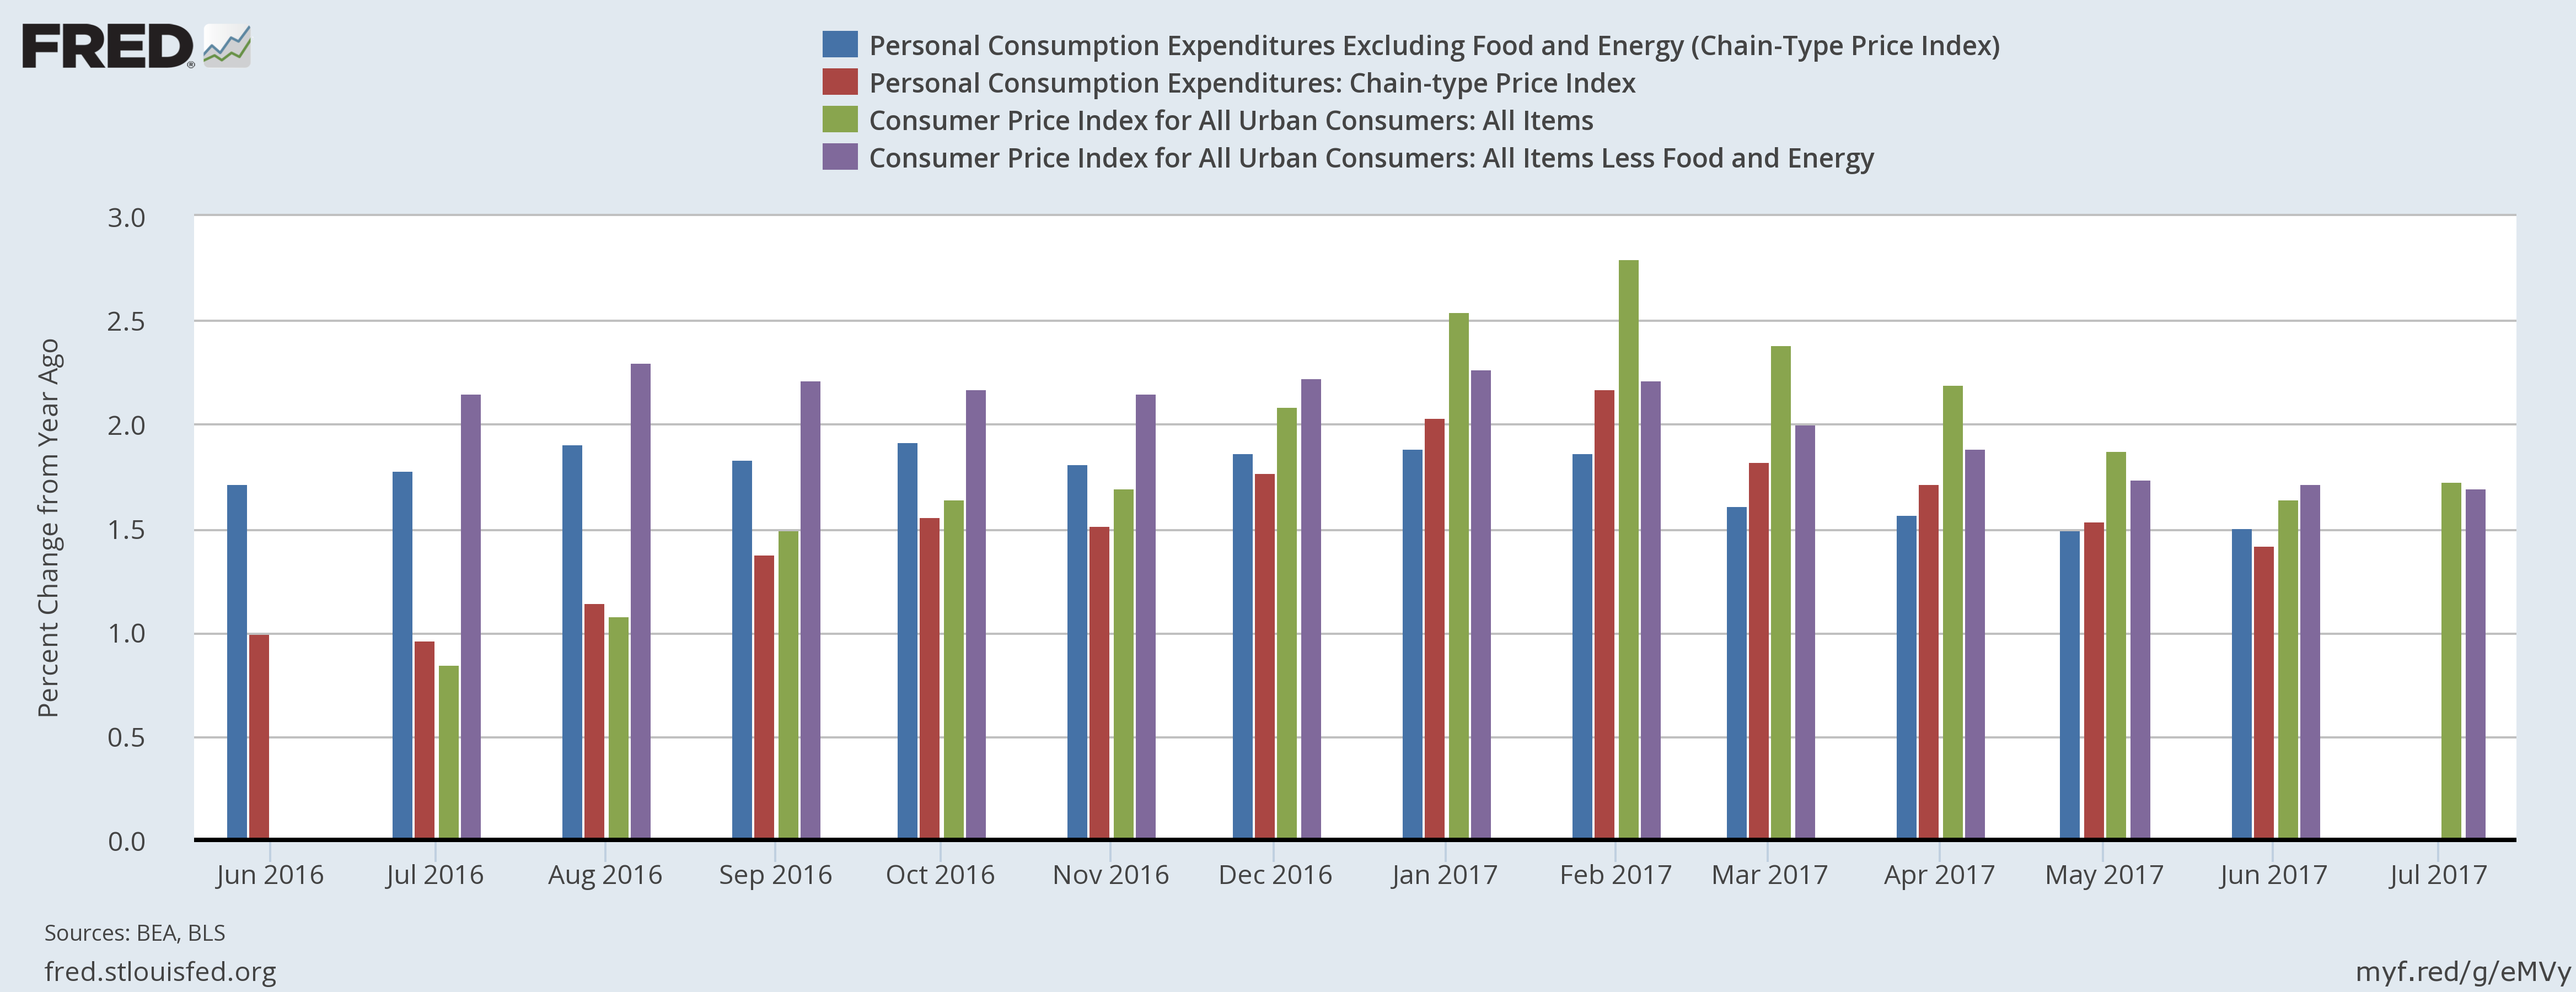
The chart above show 12 months of the Y/Y percentage change in core and overall CPI and PCE prices. Core CPI is purple. It was greater than 2% until April and has been below the Fed’s target since. The green bar is overall CPI, which was greater than 2% for five months but fell below 2% in April. The bottom chart tracks the same data over the most recent 5-year period; none of these measures meaningfully breached 2% in that stretch. The conclusion is clear: inflation has not meaningfully penetrated the Federal Reserve’s 2% target since 2012.
The next paragraph discussing inflation highlights the fed’s inflation projections:
The staff’s forecast for consumer price inflation, as measured by the change in the PCE price index, was revised down slightly for 2017 in response to weaker-than-expected incoming data for inflation. As a result, inflation this year was expected to be similar in magnitude to last year, with an upturn in the prices for food and non-energy imports offset by a slower increase in core PCE prices and weaker energy prices. Beyond 2017, the forecast was little revised from the previous projection, as the recent weakness in inflation was viewed as transitory. The staff continued to project that inflation would increase in the next couple of years and that it would be close to the Committee’s longer-run objective in 2018 and at 2 percent in 2019.
This line of reasoning is becoming increasingly perplexing. Although the Fed acknowledges that near-term inflationary pressures are weak and are getting slightly weaker–the Board once again concludes that prices will hit the Fed’s 2% target in the coming years. For the last few years, the Board has consistently believed that price pressures will perform as projected despite all evidence to the contrary.
A later paragraph not only explains why the Fed continues to use this thinking, but also presents several reasons why perhaps they should drop it:
A number of participants noted that much of the analysis of inflation used in policymaking rested on a framework in which, for a given rate of expected inflation, the degree of upward pressures on prices and wages rose as aggregate demand for goods and services and employment of resources increased above long-run sustainable levels. A few participants cited evidence suggesting that this framework was not particularly useful in forecasting inflation. However, most participants thought that the framework remained valid, notwithstanding the recent absence of a pickup in inflation in the face of a tightening labor market and real GDP growth in excess of their estimates of its potential rate. Participants discussed possible reasons for the coexistence of low inflation and low unemployment. These included a diminished responsiveness of prices to resource pressures, a lower natural rate of unemployment, the possibility that slack may be better measured by labor market indicators other than unemployment, lags in the reaction of nominal wage growth and inflation to labor market tightening, and restraints on pricing power from global developments and from innovations to business models spurred by advances in technology. A couple of participants argued that the response of inflation to resource utilization could become stronger if output and employment appreciably overshot their full employment levels, although other participants pointed out that this hypothesized nonlinear response had little empirical support.
The Fed’s model is based on a standard economic cause and effect theory: increased demand absorbs excess supply; this increases resource utilization beyond current production capacity; which forces producers to raise prices. Increased demand is also a signal to producers that they have pricing power – the ability to raise prices without negatively impacting demand.
Let’s take a look at some of the reasons the Fed raises as possible reasons for the disconnect between growth and prices late in the paragraph.
First up, a lower natural rate of unemployment: Consider Japan, where unemployment is currently below 3% yet inflationary pressures remain nonexistent.
Next, the possibility that slack may be better measured by labor market indicators other than unemployment: here, the Atlanta Fed’s the labor market spider chart provides the necessary detail.

The lower left-hand corner of the chart shows three data points that quantify labor utilization: the employment to population ratio, employees working part time for economic reasons, and employees who are marginally attached to the labor force. Despite a nearly record long expansion, all three levels are still below previous peaks.
Restraints on pricing power from global developments and from innovations to business models spurred by advances in technology are real and here to stay. U.S. business is now competing against any company who has access to the U.S. market. Some of foreign competitors have lower cost structures, lowering their input costs. This, in turn, constrains prices.
The Fed is slow to act, so don’t expect them to radically change their policies or outlook overnight. However, it does appear they are re-evaluating their understanding of how inflation materializes in the economy and the looking for new relationships to explore. This is a very good development.
We hope they will take their own advice on that score. In a recent interview outlined here St. Louis President James Bullard brought up what drives inflation as a key issue, noting that, “…the answer you get from various angles is always the same: that inflation doesn’t seem to be related to the variables that we think it should be related to.” The Phillips Curve seems to have lost its swag. Bullard maintains it never had much, and that we’re better off looking at the recent trend to gauge inflation.


Inflation, that dog just won’t bark
We are happy to report that Hale Stewart will be contributing to our blog going forward. Here’s a longer look from him, with an assist from the St. Louis Fed, at pricing trends.
Friday’s inflation report was, yet again, underwhelming, further confirming that upward price pressures are contained. Core and overall CPI are 1.7% Y/Y:
Both measures are below the Federal Reserve’s 2% inflation target. Core (in blue) was slightly above 2% for most of 2016 while total CPI (in red) was rising. But its increase did not influence overall CPI, indicating that commodity pressures are weak. Although they are part of the misery index, neither food nor energy prices should concern us in terms of sticky inflation:
The top chart shows the year Y/Y percentage change in food and beverage prices, which were declining from the beginning of 2015 to 3Q2016. They are now increasing, but are only slightly above 1%. The bottom chart shows energy prices which were negative for approximately two years, turning positive at the beginning of 2017. Yes, they did spike to about 15%, but that’s as much a function of statistics as the marketplace activity. Now they are quickly declining. Just as importantly, food and beverage prices are only 13.63% of CPI while energy prices are 7.35%, meaning both would have to increase at sharply faster rates for an extended period time for us to be concerned.
Energy and food prices are the only commodity prices adding to CPI:
All commodities less these two items have subtracted from CPI for over four years. This sub-index of overall CPI accounts for 18.95% of CPI. Its negative contributions counterbalance any upward pressure from food and energy prices.
Finally, we have the sub-index for services less energy:
This was between 3%-3.2% for most of 2016, but has since decreased sharply. The underlying reasons for this spike have dissipated.
Readers sometimes suggest we adjust spending measures, like retail sales, for certain segments’ own personal deflation in order to show that spending is actually quite strong. That gets a “Huh?” from us. If spending were strong, prices would be floating up. The point is that they are not.