People sometimes describe significant changes in productivity growth as a “mystery.” For sure, it’s a complicated question, but for us the greatest mystery is why so few people care that trend U.S. productivity growth is approaching 0, the worst performance since modern statistics began. And why do one has the will to lead a charge in hopes of reversing that trend.
But the “why” is, of course, something worth investigating. As we’ve written in the past (most recently in our February 11 issue), a low level of investment in equipment and software is part of the explanation—a contrast with the late 1990s, when we saw a burst in such investment and a consequent sharp, though short-lived, acceleration in productivity growth. Both ended with the investment bust of the early 2000s. Productivity growth then entered a long downtrend that shows no sign of stabilizing yet. Investment (as a share of GDP) fell sharply from 2000 to 2004, picked up some into 2006, and collapsed with the Great Recession. It’s recovered from the depths of 2009–2010, but remains below its 1950–2007 average. As we point out regularly when we review the Fed’s financial accounts, it’s not because Corporate America is short of funds. Managers seem to prefer stock buybacks and M&A to capital expenditures.
But that’s not all. Two recent papers offer some interesting other theories of the productivity slowdown: the malignant effects of a credit bubble on the real economy (and not just after, but during), and a low rate of business startups.
The first paper, by Claudio Borio, Enisse Kharroubi, Christian Upper and Fabrizio Zampolli of the Bank for International Settlements, investigates the effects of credit booms, labor reallocations across major sectors, and financial crises on productivity growth. Their data comes from the experience of 21 advanced economies since 1969. Borio & Co. model changes in overall productivity growth as the joint product of “common,” economy-wide features and specific movements of labor across sectors with different rates of productivity growth. They find that credit booms often lead to the withdrawal of labor from high-productivity-growth sectors, especially manufacturing, and its shift to lower-growth ones, especially construction. (This was certainly a feature of the housing bubble in the U.S.: from 2004 through 2006, annual employment growth in construction ran between 3–7%, while manufacturing growth bobbed about between 0% and -1%.)
But the subsequent bust also does serious productivity damage. As we know all too well, post-financial-crisis recessions are deeper, longer, and more persistent than the garden-variety kind. Unlike the bubble phase, where the damage is mostly the result of the bad reallocation of labor, the post-crisis phase damages both the “common” component and the allocation component. The combined effects of the bubble and bust amount to a cumulative negative shock to productivity growth of 4 percentage points that can last nearly a decade.
The second paper, written by François Gourio, Todd Messer, and Michael Siemer and published by the Chicago Fed, looks at state level data in the U.S. to determine the effects of firm entry on macro variables like the growth in GDP, productivity, and population. They find significant and persistent effects. For example, a 1% increase in the number of startups leads to an 0.1 point increase in GDP growth on impact, rising to 0.2 point after three years, and persisting (at a declining rate) for 12 years. The effects on productivity is slower, barely above 0 at first, but rising to 0.1 point and persisting (with little decay) for nearly a decade. Employment effects are more modest, on the order of 0.05 point, but persisting for up to twelve years. All in all, “a one standard deviation shock to the number of startups leads to an increase of GDP around 1.2%.” That’s not trivial.
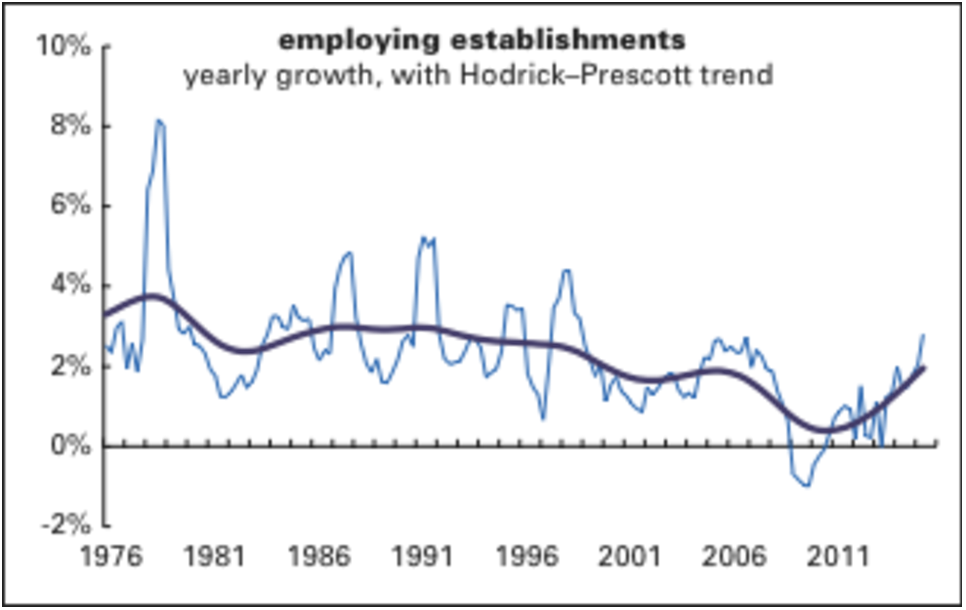
As the graph below shows, the annual growth in employing business establishments has picked up nicely from its 2009 lows, but even so, it’s just around its 1976–2007 average. (This series comes from the Quarterly Census of Employment and Wages, which is more timely than the series that Gourio et al. used, from the Business Employment Dynamics.) That pickup is encouraging, however, and might mean good things for future employment and productivity growth—if it’s sustained. But, as the next section shows, it may not be.


’flation
The late Ed Hart of the late Financial News Network used to refer to the set of topics around broad price changes as “’flation,” which neatly covers inflation, deflation, and disinflation in a single word.
Some analysts in the U.S. are getting worried about the “in-“ kind of ’flation. With core inflation hitting 2.2% for the year ending in January—though the headline figure, dragged down by the collapse in oil prices, was just 1.3%—hawks are fretting that the Fed has fallen behind the curve.
Maybe, but maybe this is better news than it seems. Graphed below are headline and core inflation for the U.S., the eurozone, and Japan. The latter two are in or near deflation, a sign of profound and extended economic weakness. The U.S., for all its troubles, is not suffering from those maladies. That 2.2% core reading is just slightly above the average since 2000; the 1.4% headline is 0.8 point below that average.
It might be a good idea to relax and give thanks that the U.S. is not caught in what our beloved if irascible John Liscio used to call “the tractor beam of deflation.” There’s plenty of time to get on top of this one if the rise persists.